Graphing Linear Inequalities Worksheet
Updated on May 17, 2026
An important step in middle school algebra is learning how to graph inequalities. Your child can learn how to plot a line and shade solution regions on a coordinate plane with the aid of a graphing linear inequalities worksheet. Kids will learn how equations, slopes, and intercepts combine to generate complete graphs through this visual exercise.
What is a Brighterly graph linear inequalities worksheet?
A Brighterly graph linear inequalities worksheet is an organized teaching tool intended to assist pupils in seeing mathematical relationships. It gives students a coordinate plane on which they can plot boundary lines using the slope-intercept form and highlight regions that indicate solutions. With the help of these tools, students may identify the proper half-planes and discern between dashed and solid lines.
Solving and graphing linear inequalities worksheet: Examples
Brighterly graphing systems of linear inequalities worksheet PDS for graphing linear inequalities in two variables make linear inequality activities interactive and visually appealing. Your child will learn how to construct inequalities in slope intercept form, graph the line, and determine which side of the line is the solution set with each graphing inequalities worksheet.
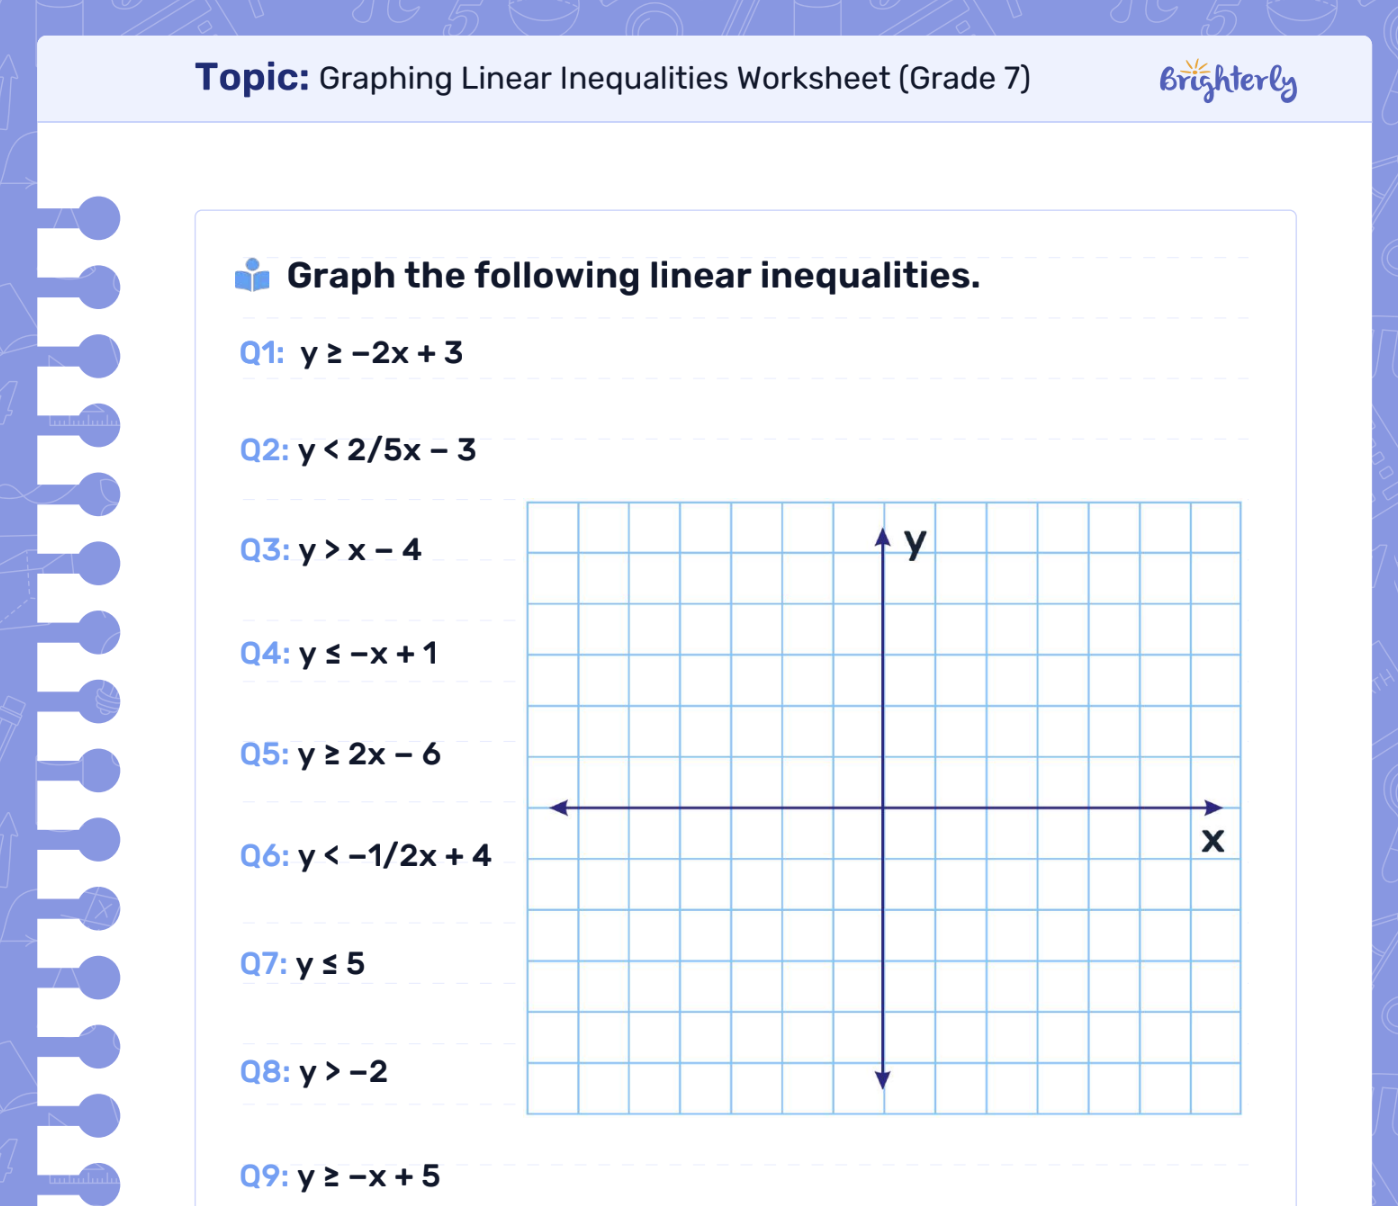
Download graphing linear inequalities worksheet PDF free
Each graphing systems of linear inequalities worksheet PDF has several different sorts of exercises where your child can write the inequality that represents the illustrated graph in addition to shading the proper graph. Instead of having your child memorize a single solution on autopilot, this double-sided drill is a good method to ensure they grasp the subject from all angles.


Help your child reach their full potential!
Answer a few quick questions about your child’s learning, and we’ll recommend next steps.
More inequalities worksheets
Brighterly also offers more worksheets for your kids learning, covering everything from basic number lines to absolute value problems.
- 7th Grade Inequalities Worksheets
- Multi Step Inequalities Worksheet
- Your One-stop Guide to the Two Step Inequalities Worksheet
- A Comprehensive Guide to the Systems of Inequalities Worksheet
Skills children practice with graphing linear inequalities worksheets
- Skill to learn through visual
- Identifying inequality symbols
- Checking test points
- Shading solution regions
- Meet academic standarts
Graphing linear inequalities worksheet improve skill to learn through visual
One of the most visual aspects of arithmetic is graphing linear inequalities. Kids may easily read the detailed graphs and visual representations in this graphing linear inequalities worksheet PDF without being overwhelmed. This will keep your child interested and focused on the material while also helping them understand the arithmetic behind it.
Note! Visually engaging and direct learning materials significantly improve focus and memory among schoolchildren learning math.
Graphing linear inequalities worksheet answers for Identifying inequality symbols
Based on the inequality sign, students select a solid or dashed line. A dashed line indicates that the boundary is not included in the solution (<, >), but a solid line indicates that it is. This aids children in identifying minute features in mathematical symbols that alter the overall solution.
Checking test points
To verify their shaded area, kids pick a coordinate, usually (0,0). They learn to double-check their logic and findings through this analytical process. Kids can read answers and determine whether they have completed the activities correctly and where they need additional assistance.
Note! Receiving immediate feedback during practice sessions is an effective learning strategy that helps kids improve their learning outcomes and average test results by almost 5 points.
Graphing systems of linear inequalities worksheet PDF with shading solution regions
This skill involves determining which side of the line contains the true values. It helps children visualize the concept of an infinite set of solutions.
Meet academic standards
To guarantee that children practice precisely what is necessary for academic success, this graphing linear inequalities worksheet answers are created in accordance with U.S. arithmetic requirements for the seventh grade. Learners can better align their skills with state tests and classroom expectations by adhering to these defined benchmarks. Students establish a solid foundation for advanced algebra and geometry by mastering these particular requirements.
Types of problems included in graphing linear inequalities answer key
- Slope-шntercept form: In order to solve problems, students must graph lines beginning at the y-axis. They determine the next point by using the rising-over-running approach.
- Systems of inequalities: These assignments feature several inequalities on a grid. The kids must meet all the requirements in an overlapped shaded area.
- Students practice graphing x > an or y < b using both vertical and horizontal lines. This makes it clearer how to deal with one-variable inequalities.
- Word problems: Students are asked to write and graph an inequity in real-world situations. For instance, figuring out how many things fit into a certain budget.
Graphing linear inequalities practice
To develop complete mathematical confidence, use Brighterly 7th-grade math test. Testing kids knowledge with a graphing linear inequalities worksheet ensures that you can handle intercepts and slopes under pressure.

To develop math confidence, use Brighterly 7th-grade math worksheets.


Need help with Inequalities?

- Does your child struggle to grasp of inequalities?
- Try lessons with an online tutor.
Choose kid's grade
Is your child having difficulties with understanding inequalities? An online tutor could provide the necessary support.
Book FREE lesson