Frequency Table in Math – Definition & Examples
reviewed by Jo-ann Caballes
Updated on October 8, 2024
Brighterly is an expert in making math easy to understand and fun to learn.
Today, we’re going to cover a core statistics concept: the frequency distribution table, which is a great method of displaying the frequencies of different outcomes in a dataset, allowing you to spot trends and patterns.
Here, we’ll cover the frequency table definition in math, how to read and create frequency tables and share frequency table examples. We’ll also share solved math problems and cool worksheets so you can test your knowledge.
What is a frequency table in math?
A frequency table in math is a table that organizes specific types of data. It allows you to understand the distributions and patterns in your data by organizing it in an easy to read way. It’s also referred to as a frequency distribution table.
First, it’s important to understand the frequency meaning in math. Frequency refers to how often a value or item appears. In the context of a frequency table, this is how many times a value or item appears in a dataset.
By using a frequency distribution table, you can see the central tendency, spread and shape of the distribution. It makes statistical analysis on your data really easy!
Definition of frequency table
The definition of a math frequency table is a table that shows values and categories, as well as their frequencies. Generally, you’ll have a list of items and outcomes, then you’ll often use tally marks to show how frequently each outcome occurs. Sometimes, the frequency is also displayed as a numeral. In other words, it shows how many times a value or outcome occurs.
The value of putting numbers into a frequency table is that you can see which are most or least common.
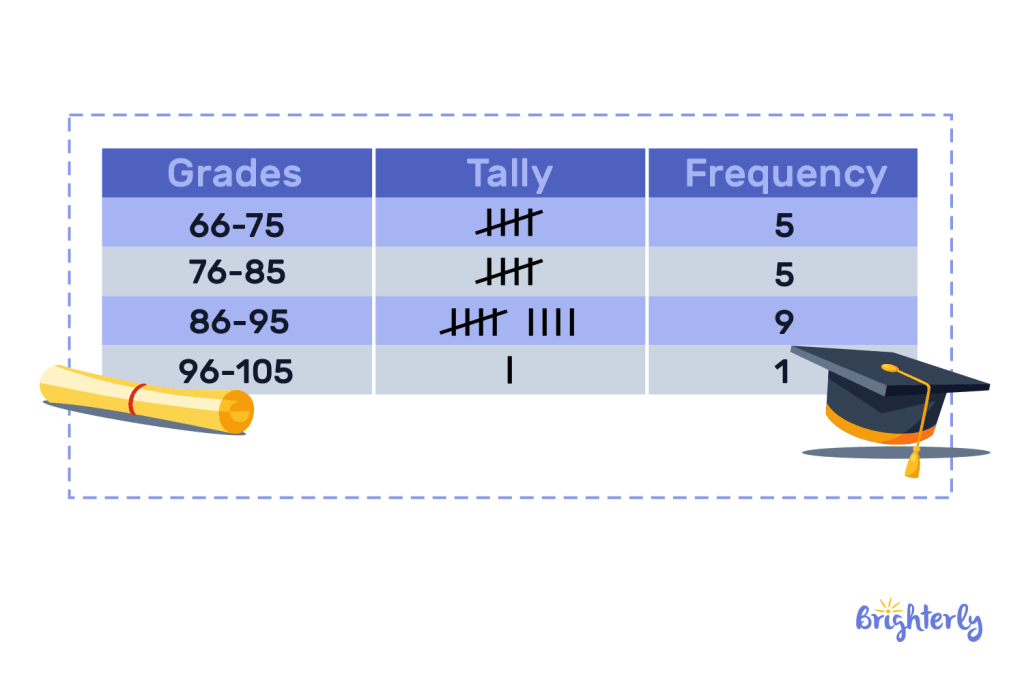
Take the below frequency table example. This shows how often students achieved grades in specific boundaries. We can see that grades between 86-95 were the most common achieved, as 9 students achieved these grades.
Figure A:
How to find frequency in math
To find the frequency of a value or outcome in math, you simply need to count how many times that value or outcome occurs. Frequency math helps you create your frequency distribution tables.
Expert Math Tutors for Every Level
Connect with professional and certified educators who provide specialized support for every grade level, from elementary school basics to advanced algebra
What is a frequency table?
A frequency table is a way of displaying data and showing the number of times a value or outcome appears.
How to read a frequency table
Usually, a math frequency table will have three columns:
- Column 1: the items in your dataset.
- Column 2: tally marks that show how often each item occurs.
- Column 3: numerals that show how often each item occurs.

At the bottom of column 3, you will have the total number of occurrences – if your data comes from a survey, for example, this can represent how many respondents there were to your survey.
Frequency tables and tally marks
Tally marks are commonly used in frequency tables because, if you’re adding up all your occurrences as you go, they’re a simple and intuitive way of keeping track of the number of times each of your values appears in your data. That makes tally and frequency tables a perfect match!
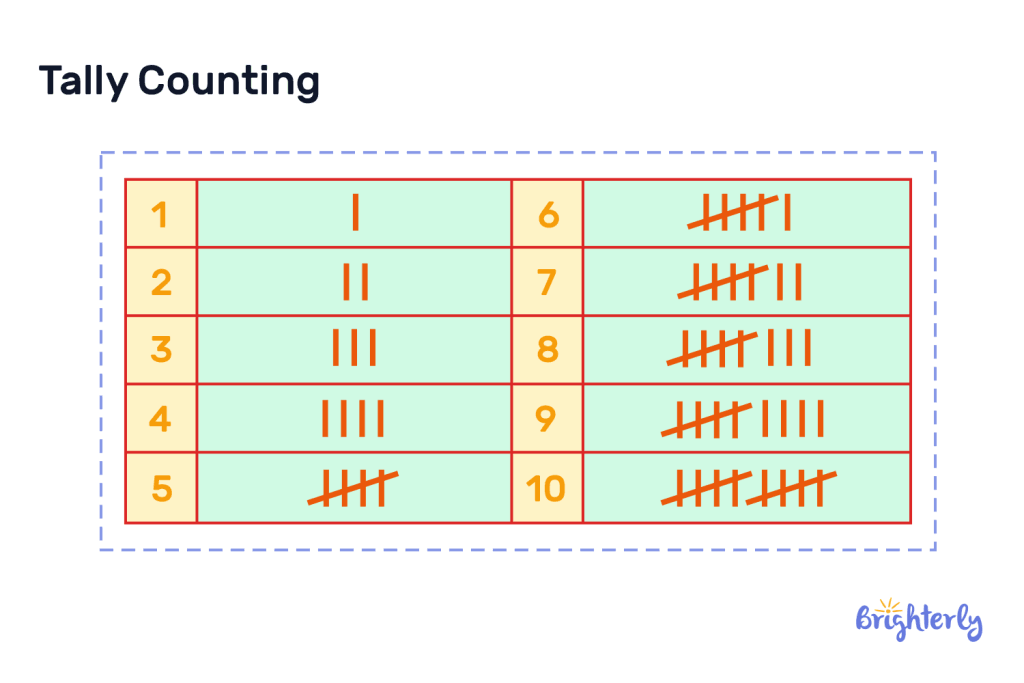
If you’ve not used tally marks before, you simply draw a short, vertical line every time your item appears in your dataset. Once you get to your fifth line, you connect your original four with a diagonal line across them. Then, you start a new tally mark. This makes it much easier to count larger numbers, because you count in blocks of five rather than each individual tally mark. Finally, convert the tally marks into numerical frequencies and enter them into the frequency table.


Help your child reach their full potential!
Answer a few quick questions about your child’s learning, and we’ll recommend next steps.
How to make a frequency distribution table
Constructing a frequency distribution table is a simple process that involves the following steps:
- Collect the data: Gather the data you wish to analyze. This may come from surveys, experiments, or other sources.
- Identify the unique values or categories: Examine the data and determine the unique values or categories present in the data set.
- Count the frequencies: Count the number of times each unique value or category appears in the data set.
- Create a table with three columns and label them with your item theme (i.e. if we use the frequency table example above, grades), tally and frequency.
- List all of the items in your dataset (if we use the example above, that’s your grade boundaries).
- In the second column, tally up how often each item appears in your dataset.
- In the third column, add up your tallies and add the numerical value.
- At the bottom of your third column, add up all your numbers.
How to complete a frequency table
Let’s say you have frequency charts that have your items listed, and you need to fill in the frequencies using your dataset.
What you’ll need to do is go through your dataset and add a tally mark for each occurrence of your item. To make sure you don’t mark the same item twice, it can be helpful to cross off each occurrence as you go. Don’t forget to group your tally marks into fives.
Once you’ve filled out all of the occurrences of your items, add up your tally marks to produce their numerical value in your “frequency” column. Finally, add up all the numbers in your frequency column to get the total number of occurrences in your dataset.
Frequency distribution table for grouped data
If you’re dealing with a dataset that has many individual items – for example, let’s use our grade table, which has a range of 66 to 105 – you can group your data into intervals or classes to make it easier to read and understand.
This also means you can more easily analyze and visualize your data, which is essential to spotting trends and patterns and coming to meaningful conclusions.
Here are the steps you need to follow to create a grouped frequency distribution table:
- Subtract the lowest value item from the highest value item to understand the range of your data – in this frequency table example, 105 – 66 = 39.
- Choose how you’ll group your data into class intervals – we recommend using groupings that are widely understood, like groups of 5 or 10. In this example, we’re using groups of 10.
- Calculate the class width by dividing the range by the number of class intervals.
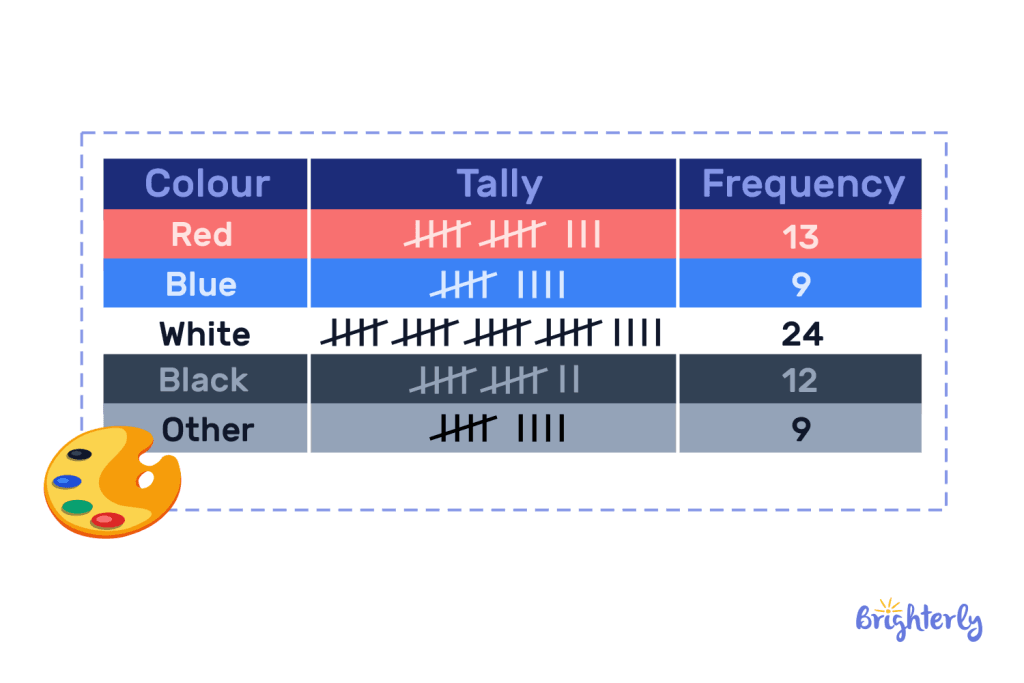
- List the class intervals in one column and their corresponding frequencies in another column, per the below example:
Solved math tasks: examples
Now that we’ve covered what a frequency distribution table is, how to create one and how to use tally marks, it’s time to put your knowledge to the test with our solved math tasks! Do the math yourself, then check our answers afterwards to see if you’re right.
Solved math task 1
Which of the following data can be represented as frequency tables?
- The number of students in a specific age group at school
- The total number of votes in a class election
- The age ranges of people who watch the news every day
Answer:
| The age ranges of people who watch the news every day. |
This is because this is the only example of a dataset with multiple variables or answers.
Solved math task 2
Create a frequency table that represents the frequencies of this data:
| White | Black | White | Blue |
| Pink | Blue | Pink | Blue |
| Blue | White | Blue | White |
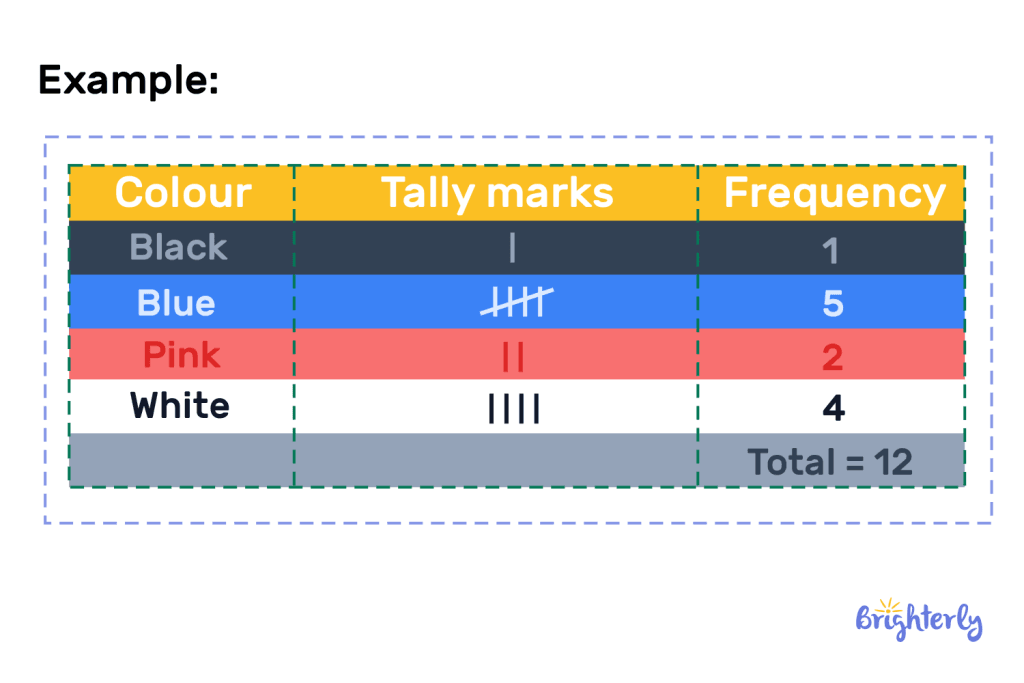
Answer:
Your frequency table should look like this:
Frequency tables: practice math problems
Frequency tables: worksheets
Practice makes perfect, so why not use our free math worksheets to improve your frequency distribution table knowledge?


Problems with Measurement?

- Does your child struggle with mastering measurement lessons?
- Try studying with an online tutor.
Choose kid's grade
Is your child having difficulties with understanding the concept of measurement? An online tutor could provide the necessary help.
Book FREE lesson