Addition Table: Definition, Examples, and Practice Math Problems
reviewed by Jo-ann Caballes
Updated on November 20, 2024
We use addition to determine the result of two or more numbers when they are combined.
The addition table makes the process simpler. Keep reading to learn more about the chart, examples, practice questions, and helpful addition table worksheets.
Addition Table: Definition
The addition table is a tabular chart of numbers written in rows and columns to help us find the sum of numbers without manually calculating it through addition.
Addition, represented with a “+” sign, is an arithmetic operation that involves putting together two or more quantities to get a new quantity. For instance, if Joe has 3 pieces of oranges and Harry has 2 pieces of oranges, we use addition to know the total amount of oranges they both have.
With the addition table chart, we can easily determine the total value. Let’s use an addition table of 1–5 for instance:
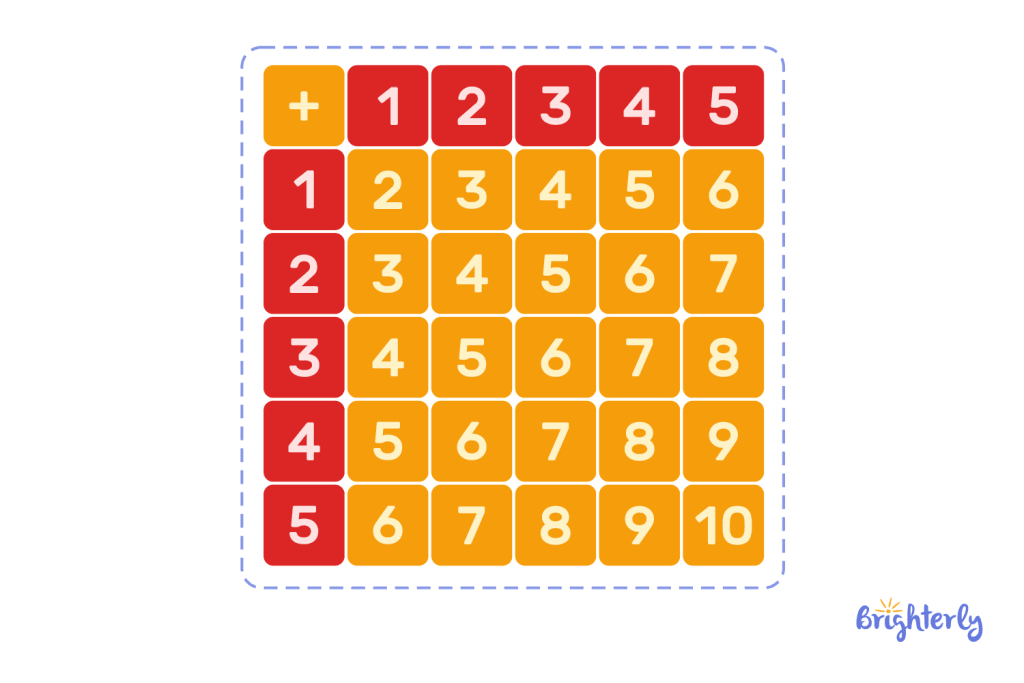
Excluding the first row and column, there are 5 rows and 5 columns in the table. These are the numbers we can add. They are known as addendums.
The numbers on the rows and columns of the addendums will be from 1-5 with a “+” sign at the top left corner. To know how many oranges Joe (3) and Harry (2) both have, we’d trace the column of 3 to the point where it intersects with the row of 2, they meet at 5. We also get the same result if we trace the column of 2 to where it meets the row of 3, and if we trace the rows to where they meet their columns.
Therefore, the addition table can prove to be an easier way to do the addition of numbers without doing the algorithmic calculation.
Addition Table 1 to 10
The addition chart 1-10 also follows the same instructions as the 1-5 addition chart, except that the addendums are from 1 to 10.
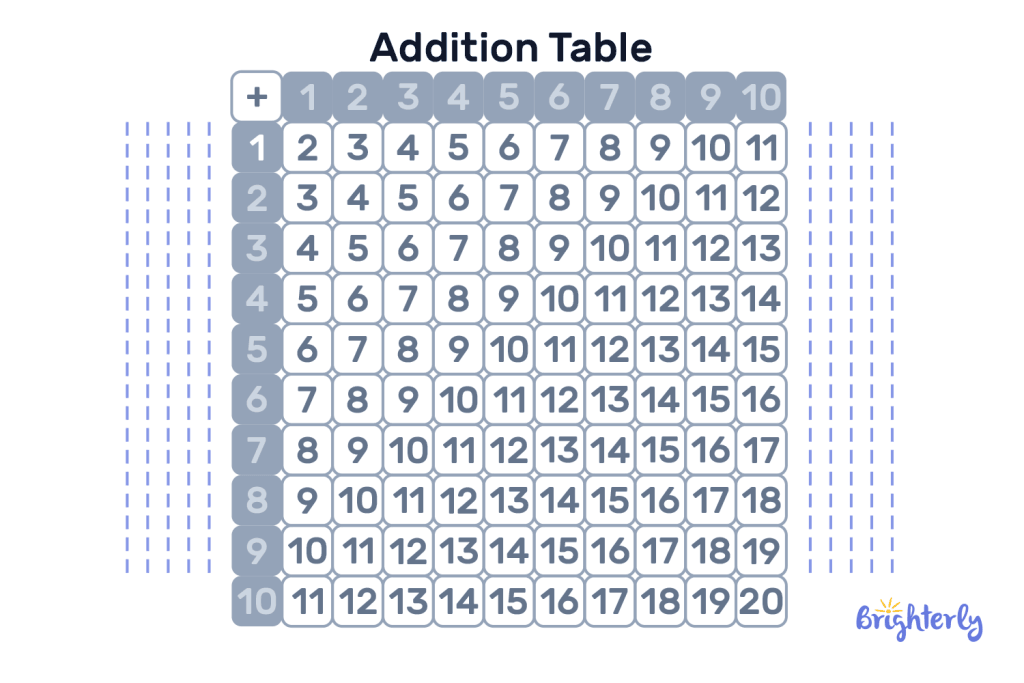
This table is most appropriate for finding the sum of numbers that are below or up to 10. If we want to find the sum of numbers that are more than 10, we can use the addition chart of 1-20.
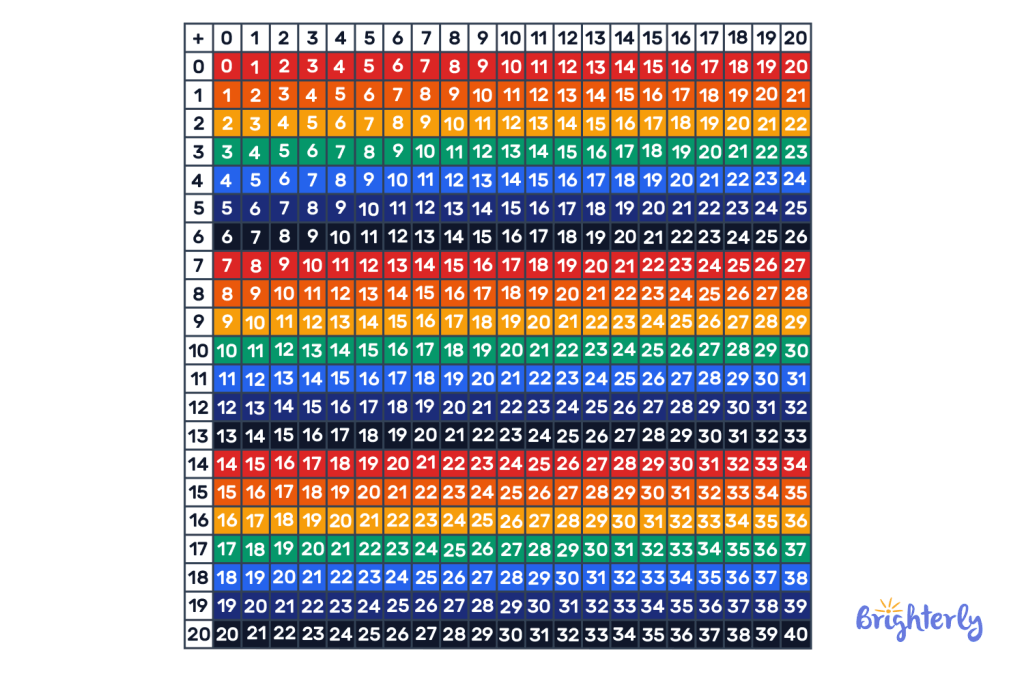
Addition Table 1 to 20
The addition chart 1-20 has rows and columns of addendums that go from 1 to 20 which makes it easy to identify the sum of any two numbers that fall under 20, this table works well for adding double digits under 20:
How to Use an Addition Table?
The addition number chart is made up of numbers arranged chronologically in rows and columns for the summation of the numbers that are in the first row and column called the addendums.
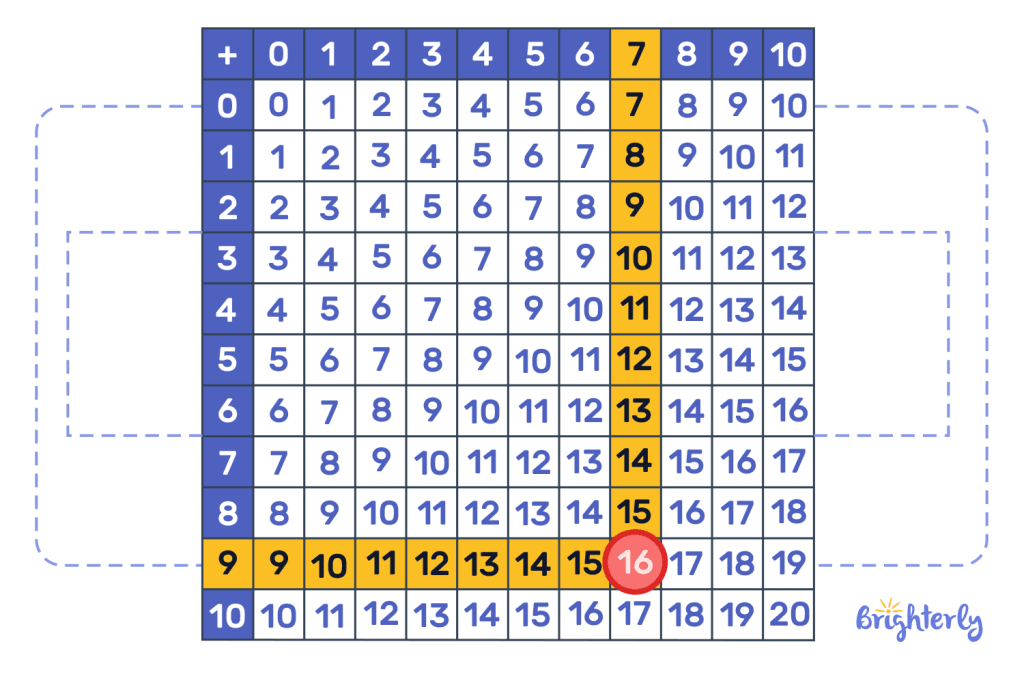
Here’s how to use the addition table:
Step 1: Identify the first given number on the addendum row or column
Step 2: Identify the second given number on either the addendum’s row or column
Note that if you select the first given number on the addendum row, you must select the second number on the addendum column and vice versa.
Step 3: Find the number where the column and row meet.
For instance, when looking for the addition of 9 and 7 using the steps above, we get 16:
Addition Facts Table
An addition fact is any addition equation that has to do with only two single-digit numbers. Addition facts examples include 7 + 3 =10. 2 + 2 = 4, and more.
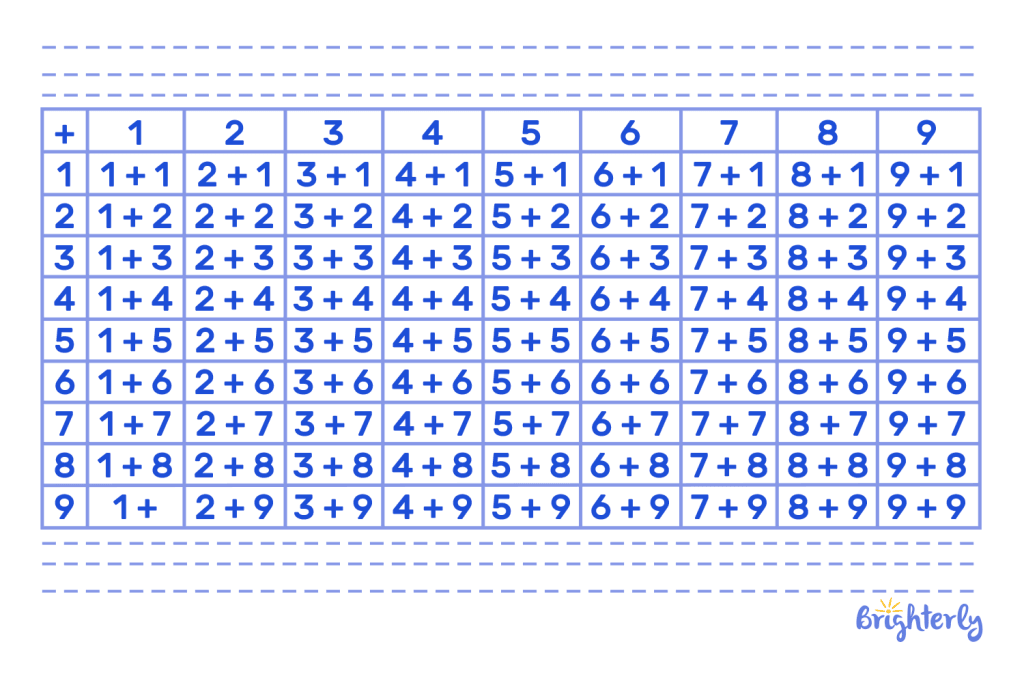
Young mathematicians must know addition facts. Luckily, the addition fact chart can help with this:
Addition Table: Patterns
Certain patterns are always present in an addition table. Here are some of them:
- When two even numbers are added together, the answer is always an even number
- We can switch the order of the addendums and it wouldn’t affect the result.
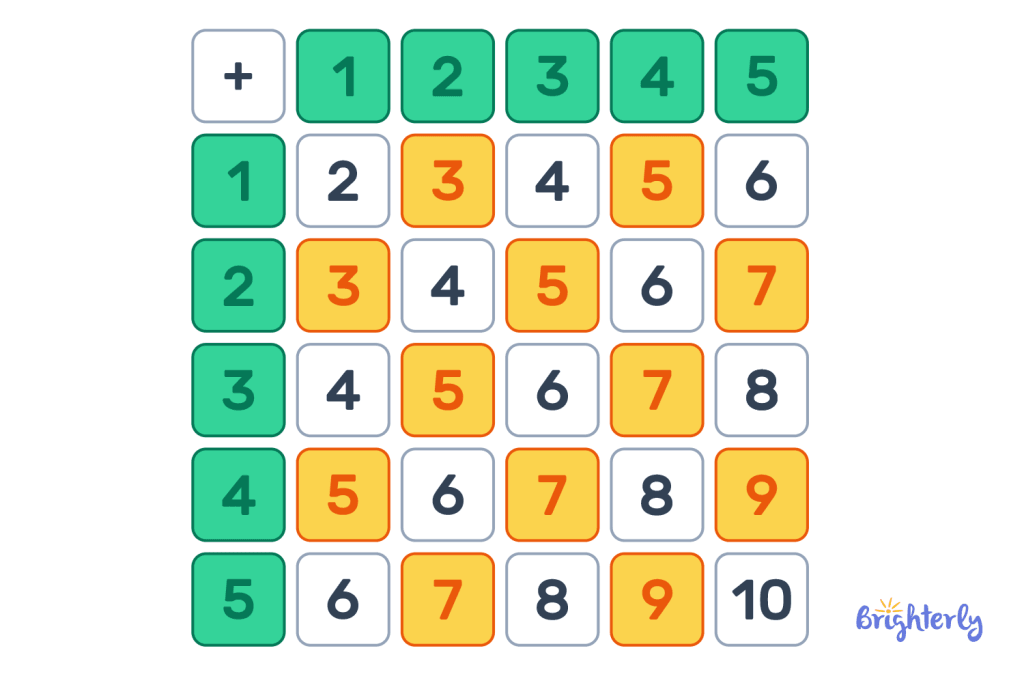
- When we add 1 to an even number, it becomes an odd number. If done continuously, a pattern is formed in the table with one even number and one odd number side by side, as so:
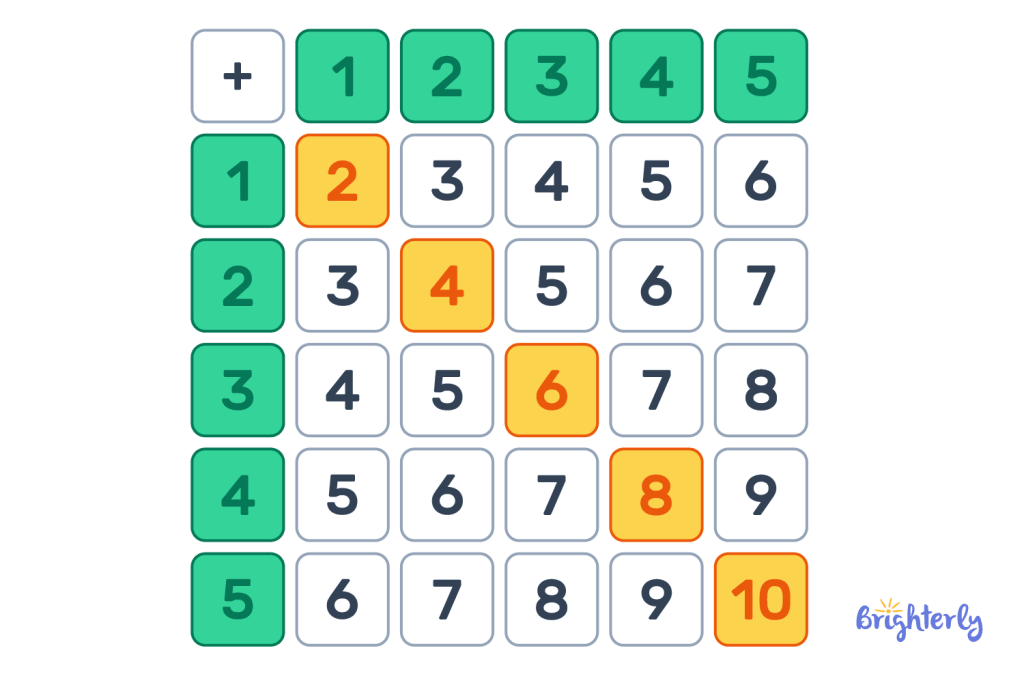
- When counted diagonally from the top left corner, we get 2, 4, 6, 8, 10, 12 and so on.
It also helps to know these patterns because it helps you confirm if the answer is correct.
Solved Math Tasks: Examples
Solved math problem 1
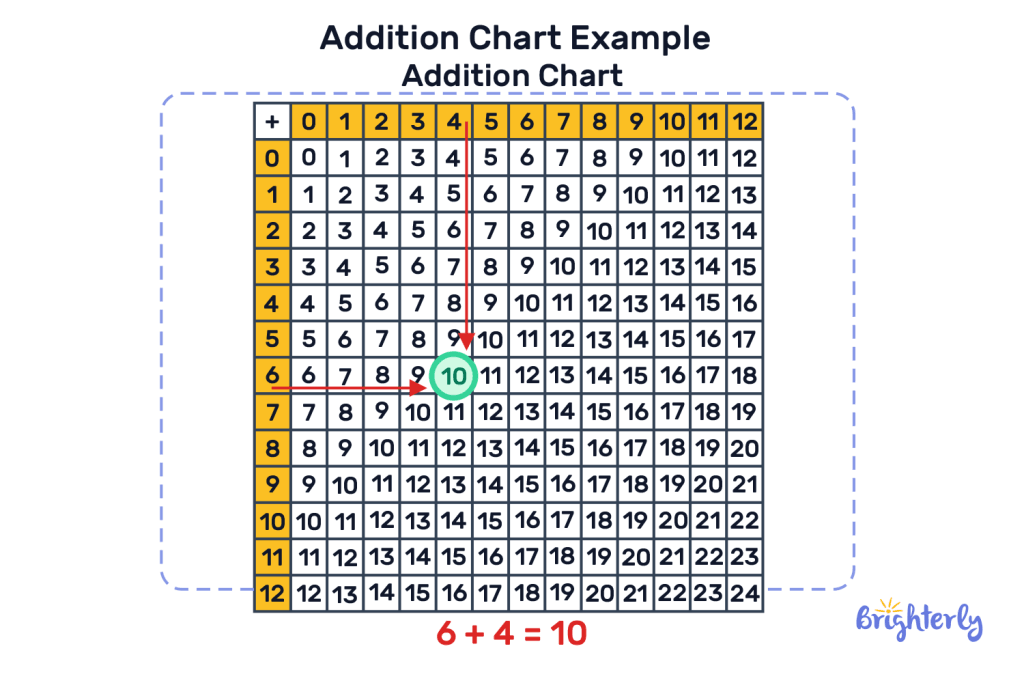
Jeremy’s class has 4 female students and 6 male students. He wants to know the total number of students. Using an addition table chart that goes from 1-12, answer the question.
Answer
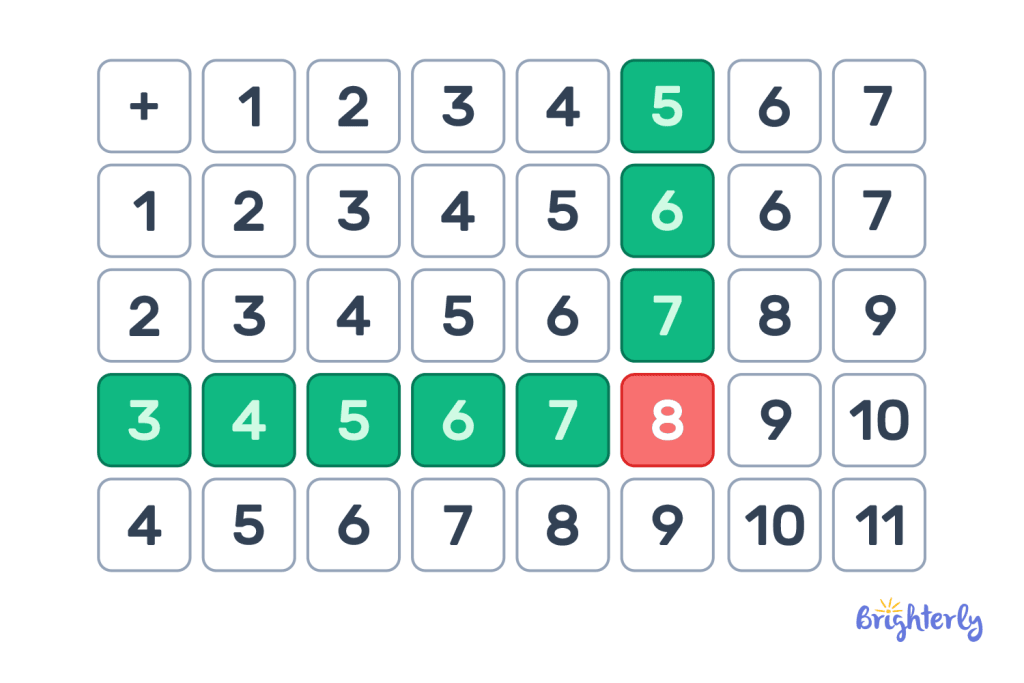
We find the point where 4 meets 6 in the chart which is 10.
| Therefore, there are 10 students in the classroom. |
Solved math problem 2
Write all the addition facts for number 8
Answer
|
8 + 1 = 9 8 + 2 = 10 8 + 3 = 11 8 + 4 = 12 8 + 5 = 13 8 + 6 = 14 8 + 7 = 15 8 + 8 = 16 8 + 9 = 17 8 + 10 = 18 |
Solved math problem 3
Greg’s table has 5 cupcakes, his mom adds 3 more. With an addition table chart, help Greg find the total amount of cupcakes on the table.
Answer
Again, we first trace the number 5 to see where it meets 3.
| The point of intersection is number 8, meaning there are 8 cupcakes on Greg’s table. |
Addition Table: Practice Math Problems
Addition tables worksheets
Knowing how to add numbers is a must-have skill for children. With addition tables, it is easier to do addition equations without actually doing calculations. Practice more with our addition tables worksheets:


