Critical Value – Formula, Definition With Examples
reviewed by Jo-ann Caballes
Updated on July 15, 2025
Welcome to Brighterly, where we simplify even the most complex math concepts!
Today, we’re exploring statistics and the concept of critical value.
Critical value is a fundamental cornerstone in statistics and is used in hypothesis tests to decide whether an observed effect or result is statistically significant.
We’ll cover the critical value definition, different types of critical value, how it differs from test statistics and finding critical values using critical value formulas. We’ll also give you practice test questions and cool math worksheets so you can practice your knowledge!
What is a critical value?
A critical value is used in a hypothesis test in statistics. In hypothesis tests, we compare two items: a test statistic and a critical value. We reject the null hypothesis if the test statistic is more extreme than the critical value.
Let’s use an example and say Brighterly tutors are testing a new teaching method. Our hypothesis is that it’ll improve students’ math scores. By comparing the average scores of students who use this new method (the test statistic) to a critical value, we can understand if it’s effective. In this case, if the average scores are much higher, we can conclude the teaching method is effective. That is a significant result.
Critical value definition
The definition of critical value is a numerical value that determines the cut-off point between rejecting a null hypothesis and failing to reject it. In other words, it can tell us whether an outcome is unusual or significant.
Critical value example
Let’s look at another example. If you’re throwing darts at a target, your critical value is the boundary that separates your bullseye from the rest of the target. If you hit anything inside that boundary, you’d consider it significant.
Critical value confidence interval
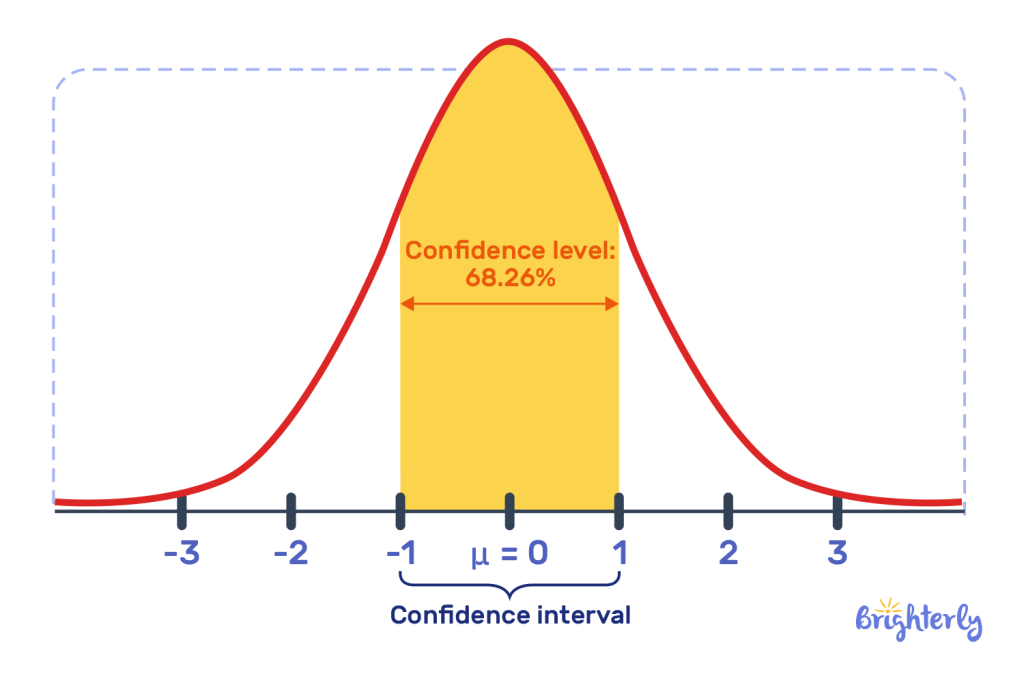
The confidence interval is another key element of hypothesis tests. It`s a range where we expect our mean, or proportion, to be in. For example, if you have a 95% confidence interval, you’re 95% confident your true values lie in that range. The confidence interval is determined by the critical value – the higher the critical value, the more confidence you have in your hypothesis.

Z critical value
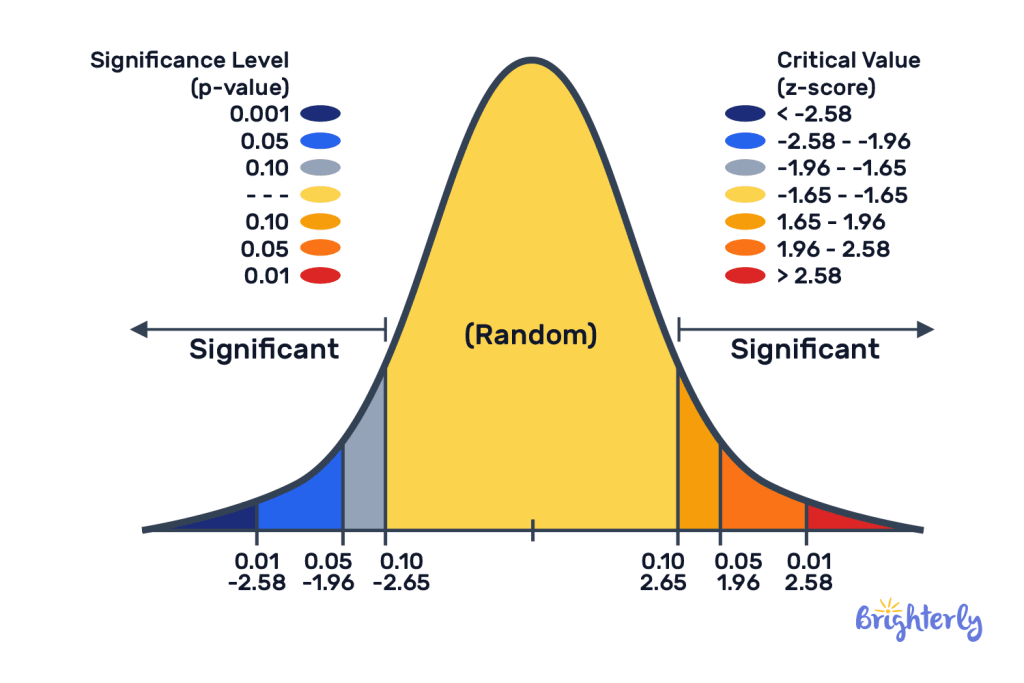
The z critical value is used in a normal distribution, i.e. data on a bell curve, to determine our level of confidence in our hypothesis. Z critical values are standardized – for example, with a 95% confidence interval, our z critical value is 1.96. If our confidence goes up to 99%, our confidence interval is 2.58. It’s a common critical value used with sample sizes of more than 30 where we also know the standard deviation.

T critical value
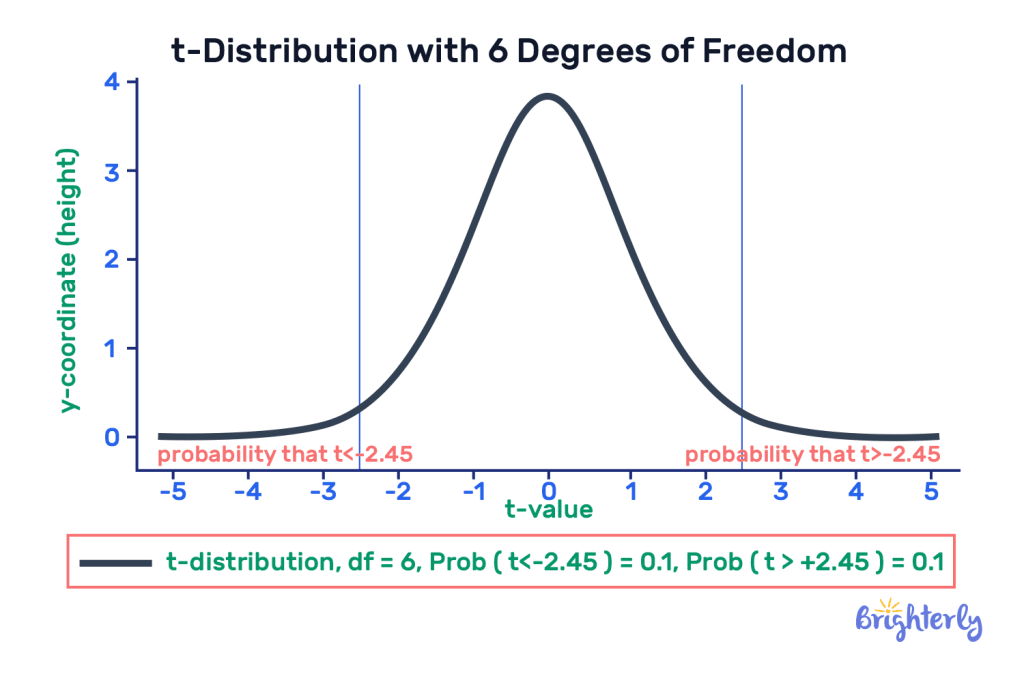
T critical values are based on t-distribution, which is a type of probability distribution. It’s a type of curve similar to a bell curve (i.e. normal distribution) but has thicker tails. It gives us more accurate results with smaller datasets or when we lack information. The t-test is determined using a t-table, which helps us find our critical t value – i.e. a number from our t-table that determines whether our results are significant.

F critical value
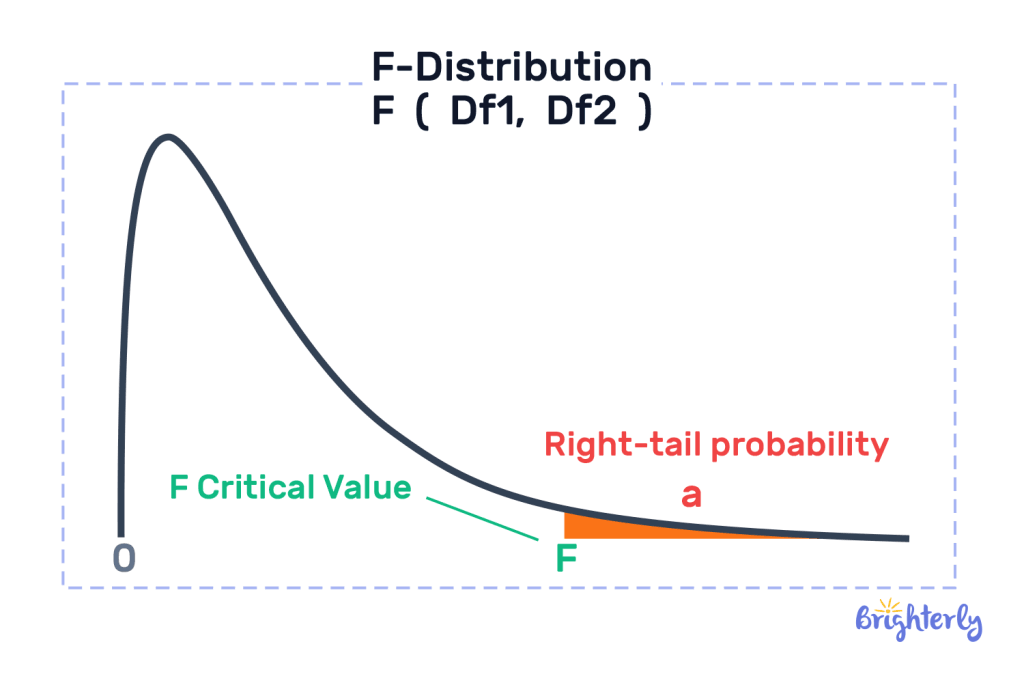
F critical value is a specific type of critical value used when comparing 3 or more groups. We’re looking to see if at least one group is significantly different. This makes f-tables larger and more complex, as there is more data. The tests that use f critical value are known as ANOVA (analysis of variance) tests.

Definition of critical value in statistics
The definition of a critical value statistics is a numerical value that determines where we would accept a null hypothesis or where we would reject it. It’s used as a threshold in hypothesis tests.
Definition of test statistic
The definition of a test statistic is the other key element of your hypothesis test. The test statistic is a mathematical formula that determines whether or not we reject our null hypothesis. We compare the test statistic and the critical value with one another in our hypothesis test.
If we use our earlier examples, with darts hitting a target, our test statistic would be the dart we throw at our hypothetical dartboard. In the example of trialing a new math learning method, the test statistic is the average math score of students using the new method. Our test statistic is based on our sample data.
Test statistic vs critical value
Test statistics and critical value are both used in hypothetical tests. Although they are compared, they are completely different entities. We cover their properties and differences below.
Properties of critical values
Critical values have some important properties that define them and make them an essential concept in statistics:
- Fixed by significance level: we are able to determine the significance level for our hypothesis test, i.e. what makes something significant. Often, the significance level will be around 5% (0.05), but it will depend on the researcher and the test itself.
- Depends on the distribution: the type of probability distribution we choose to use will play a role in determining our critical values. Often, normal distribution, t-distribution and chi-square distribution are used.
- Directional: critical values can either be one-tailed (we check for an effect in one direction only) or two-tailed (we check for an effect in both directions).
Properties of test statistics
Like critical values, test statistics also have some important and unique properties in relation to statistics.
- Calculated from sample data: we use the data from our sample to calculate our test statistic. Therefore, it is reflective of the data we have collected.
- Depends on the null hypothesis: our null hypothesis – aka the statement we are testing – will determine how we calculate our test statistic.
- Random: test statistics are random variables because they are calculated from sample data. We would get a different test statistic if we collected a different sample.
Difference between critical value and test statistic
The critical value and test statistic are both important when it comes to hypothesis testing, but they are different. Our critical value is predefined and determines at what point we reject our null hypothesis. Our test statistic, meanwhile, is based on our sample data. This is how we distinguish critical value from test statistic.
Formulas for critical values
There are multiple formulas for the critical value. Each formula depends on the nature of your test and the distribution of your sample data. Here’s some guidance around critical value equations:
- T critical value formula: the formula is T=T(df,1−α/2) and you use a t-table
- Z critical value table formula: subtract the alpha level from 0.5 for a one-tailed test, or 1 for a two-tailed test, and find the area in your z-table to find your critical value
For a quick finding of t and z critical values use the critical value calculator that gives critical values for left-tailed, right-tailed, and two-tailed distributions in a single click.
Understanding the formula for calculating critical value
Depending on the type of hypothetical test you’re doing, you’ll use different methods of calculating critical value:
- T-tests: you’ll use the degrees of freedom (df – related to your sample size) and your identified significance level to calculate critical value. These come from your t-table
- Z-tests: you’ll use a z-table to calculate critical value. This table shows you the relationships between your z-scores and percentages
Writing the formula for critical values
Writing your formula for critical value will vary depending on the statistical test you use. If you’re using a t-test, your formula can be written as *T = T(df, 1-α/2)**. Here, α is your chosen significance level and df is the degrees of freedom.
If you’re using a z-test, your critical value formula can be written as Z = Z(1-α/2)* for a two-tailed test, where α is your chosen significance level.
Solved math tasks: examples
Ready to test your knowledge on critical value? Try out our solved math problems below!
Solved math task 1
You need to create a 95% confidence interval for a population mean using a sample size of 50. You know the population standard deviation is 10. What is the z critical value?
Answer:
| 1.96. |
With a 95% confidence level, the standard z critical value is 1.96.
Solved math task 2
You have 25 apples and you want to see if their average weight is 150 grams. You’ve given a standard deviation of 20 grams. Find the t critical value with a 95% confidence level in a two-tailed test.
Answer:
| Approximately 2.064. |
For a two-tailed test at a 95% confidence level with 24 degrees of freedom, using the t critical formula, the t critical value from the T-table is approximately 2.064. You can use a t critical value calculator to work this out.
Critical value: practice math problems
Critical value: worksheets
Cement your knowledge with our supporting math worksheets!
Frequently asked questions on critical values
What is a critical value?
A critical value is a value we use in hypothetical tests to establish the lower and upper bounds of our confidence intervals. It is the cut-off point for data that we deem statistically relevant in our test and it determines whether we reject or accept our hypotheses.
What’s the difference between a critical value and a test statistic?
The difference between a critical value and a test statistic is what they represent and the way they are used. We determine our critical value before our hypothesis test and use it as a threshold to understand whether our data is statistically significant. Our test statistic is the result of our sample data and is created by our test.
How do I calculate a critical value?
How you calculate a critical value will depend on the type of test you carry out. You’ll use a t-table to calculate your t-test critical value based on your degrees of freedom. Z-tables, meanwhile, link percentages to z-scores and help you find your z-test critical value.


