Experiment Math Definition with Examples
Updated on February 11, 2026
Probability is a numerical measure of how likely an event is to occur. Depending on the situation, probabilities can range from 0 to 1. If something is impossible, the probability is 0. If the event is certain to occur, the probability is 1.
What is the experiment math probability? The experimental probability is calculated by repeating an experiment and observing the results. That’s called repeated experiment math definition.
What is an experiment in math?
How to define an experiment? Mathematically, an experiment is “a process or procedure that can be repeated with well-defined outcomes or results.”
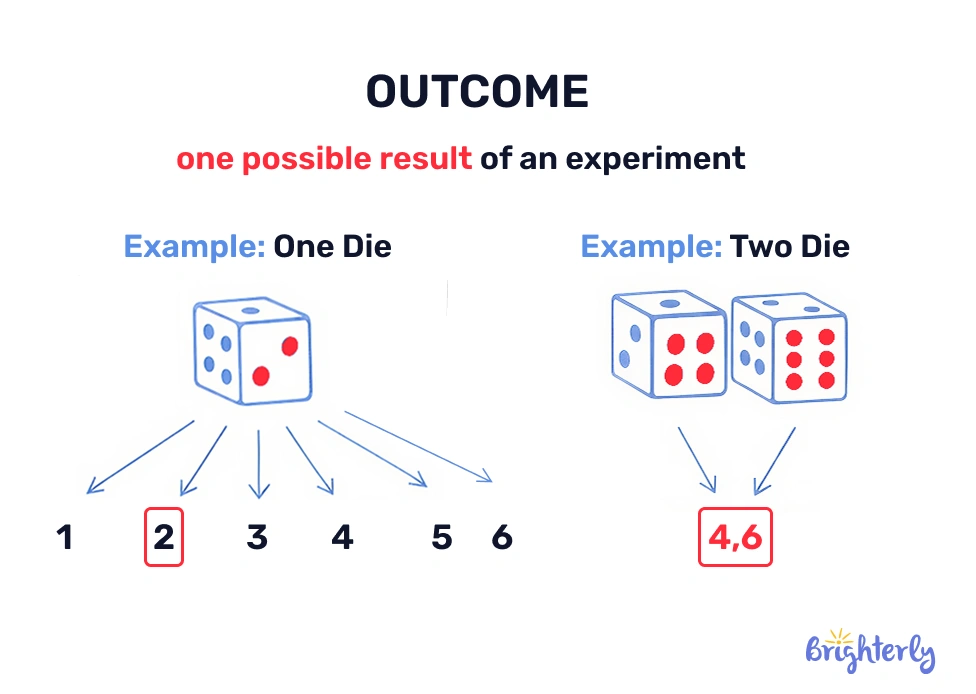
Let’s look at the same example. According to the experiments definition, if you flip the coin 50 times and record the outcomes, you will get heads or tails. If these outcomes are used to calculate probability, the resulting probability is called experimental probability. Experimental probability is the ratio of the number of times an event occurs to the total number of trials.
Expert Math Tutors for Every Level
Connect with professional and certified educators who provide specialized support for every grade level, from elementary school basics to advanced algebra
What is the purpose of an experiment in math?
The purpose of an experiment in math is to provide warrants — evidence that supports or validates mathematical conjectures.
In school, we do experiments to learn how to think logically and work with our hands. Experts explain that in math, there is a difference between “theory” and “reality.” Theory tells us what should happen (like a coin landing on heads 50% of the time). But a real experiment meaning shows us what actually happens when we flip the coin ourselves. This helps children see the difference between what we expect and what we get. Key Functions of Mathematical Experiments:
- Students record their actual scores during basketball practice instead of just guessing their average shooting success.
- A good experiment math example is when, after rolling a die 100 times, a student sees that each number appears almost equally, even if the first few rolls were only ones.
- A player understands that a 10% chance to find a rare item in a game does not guarantee it will be in the very next chest they open.
Experiment in math examples
Experimental probability is based on what actually happens during a test. Here are simple examples of the definition of experiment and how to calculate it using real results.
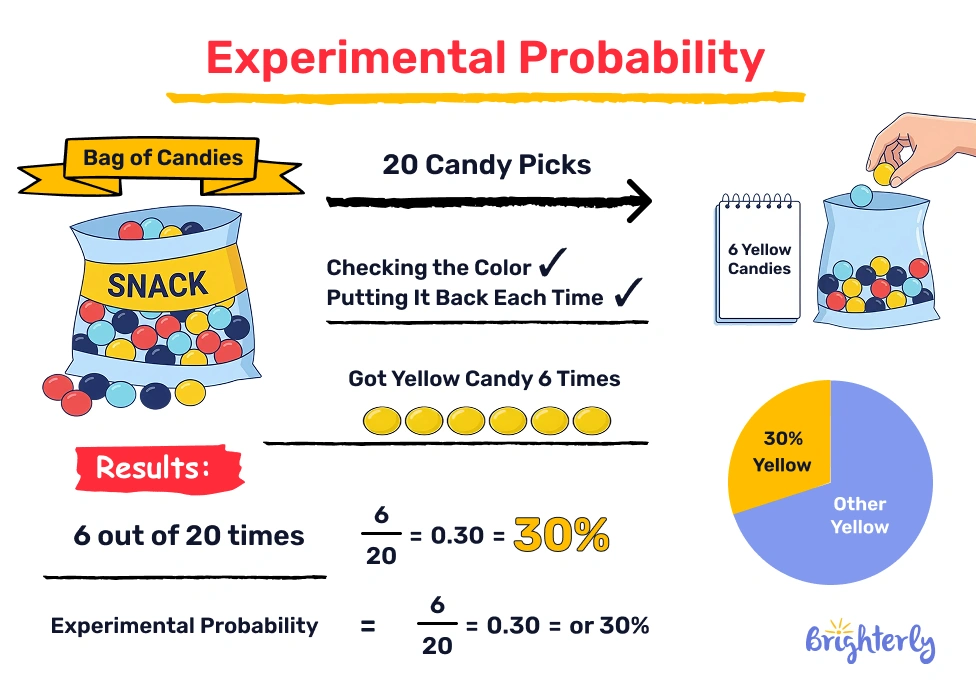
- Suppose you have a snack bag with different colored candies. You pull out a candy 20 times, check its color, and put it back each time. If you get a yellow candy 6 times, your experimental probability is 6/20, which is 0.30 or 30%.
- Imagine you are playing a board game and need to roll a “6” to start. You roll the die 30 times and record that the number “6” appears only 3 times. Your experimental probability of starting the game is 3/30, which is 0.10 or 10%. Here is where the math experiment takes place.
- You are practicing penalty kicks in soccer. Out of 15 kicks, you successfully score 12 goals. Based on past data, the experimental probability of scoring is estimated as 12/15.
Properties of experiment in math
Knwowing of an experiment definition in math isn’t enough! Any type of probability possesses some key characteristics, including experimental probability. There will always be a value between 0 and 1 (or 0% and 100% when expressed as a percentage). As the number of trials increases, experimental probability may approach theoretical probability, but no outcome is guaranteed.
There is also a key property: all possible outcomes have probability 1. The experimental probabilities of heads (0.7) and tails (0.3) add up to 1.
Parts of an experiment in math
Here’s how experiments work:
Step 1. Identify the study’s subjects.
Step 2. Check if the participants were randomly chosen for the experiment.
Step 3. Check whether groups have been randomly assigned.
Step 4. Determine which variable is being manipulated by the researcher (explanatory variable).
Step 5. Identify the treatment variables (explanatory variables).
Step 6. Find the variable that shows the outcome of the experiment (response variable).
What are the components of an experiment?
- Experimental subjects: The people who participated in the experiment.
- Random Sampling. A random sampling ensures that each member of the population has the same chance of being chosen.
- Random Assignment. Subjects are assigned to groups within the experiment according to an equal chance system.
- Explanatory Variable. We may consider this as a possible cause, since the researcher manipulates the variable.
- Treatments. Differences in the explanatory variables.
- Response Variable. This is the outcome or the effect of the experiment that we are trying to study.


Help your child reach their full potential!
Answer a few quick questions about your child’s learning, and we’ll recommend next steps.
Types of math experiments
To understand experiment meaning in math is impossible without knowing the types of math experiments. That’s why we group them based on how we predict results and how they are found.
Based on predictability
- Experiments with random results: These tests cannot be predicted precisely. As an example, you know a die has six sides, but you have no idea which number will land face up on it.
- Deterministic Experiments: This experiment always produces the same results regardless of the conditions. Gravity always pulls a ball toward the ground at the same speed if it is dropped.
Based on methodology
- Probability Experiments: These focus on chance and repeat a trial many times to see what actually happens. You compare the real results of your trials to what the math formulas predicted.
- Scientific Experiments: These use math and statistics to test a new idea or hypothesis. A scientist might give a new medicine to one group and nothing to another to see if there is a real difference.
- An experimental mathematician uses a fast computer to discover hidden patterns in very large numbers. The method helps mathematicians find new rules for constants like /pi that are too long to calculate manually.
Conclusion
With Brighterly, understanding experiment definition math is much simpler and more fun than it looks. You have learned that deterministic experiments always have the same result, like dropping a ball. You also know that a random experiment is like a game where the result is a surprise every time. You now understand that theory is what we expect to happen, but experiments show us what truly happens in real life.
It is great that you now understand:
- How to find patterns
- How to be a logic expert
You also see probability in your favorite video games, sports, and even the weather. As a result of these activities, a solid foundation for advanced logic and statistical reasoning is built.
Frequently asked questions on the experiment in math
What is an experiment in mathematics?
An experiment is a repeatable procedure used to observe outcomes under specific conditions. In probability, it is a process — like flipping a coin or rolling a die — where the result is uncertain. Each time the process is performed, it is called a trial, and each trial produces a recorded result.
What is the experimental method in math?
The experimental method is a way to find answers by doing a task many times and recording the results. You repeat a trial, like flipping a coin or rolling a die, to collect real data.
What is the difference between experimental and theoretical math?
Theoretical probability expresses what to expect. Experimental probability, however, explains how often an event occurs. It is theoretically possible to get any particular number, say 3, by rolling a die. In contrast, if you roll the die 100 times and record how many times 3 appears, say 65 times, then you have an experimental probability of getting 3 65/100.


Math & reading from 1st to 12th grade
Looking for homework support for your child?

Choose kid's grade
Math & Reading for Grades 1–12
Build real confidence for your child with a Brighterly math or reading tutor.