Range in Math: Definition, Formula, and Examples
reviewed by Jo-ann Caballes
Updated on October 4, 2024
In statistics, range in math is the interval between the two extremes— highest and lowest values— of the distributed numbers. It is a crucial component of every data collection. This article covers all you need to know about the range and how to find it.
What Is a Range in Math?
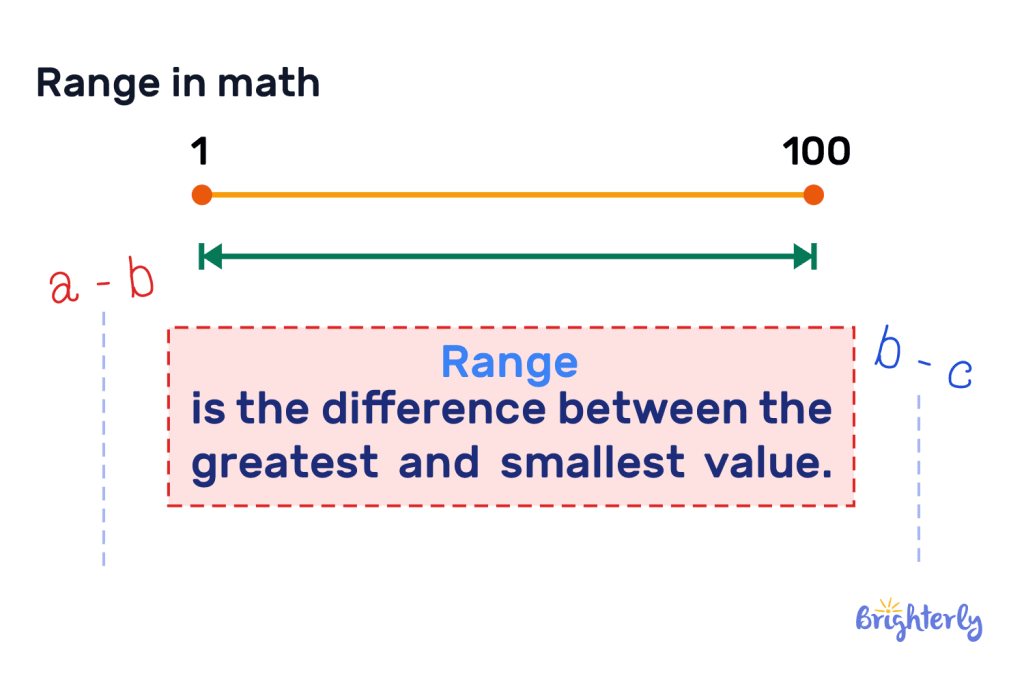
In math, subtracting the highest and lowest values gives you the range formula.
Range = highest value – minimum value.
Range in math: Definition
You can define range in math as the interval between the highest and lowest values in a set of numbers. It can be seen as the dispersion of the data or the distance between the data’s lowest and highest points. The range of an algebraic function is its solution or output.
Example
What is the range of numbers
[12, 15, 6, 14, 30]?
The largest value = 30
The smallest value = 6
Therefore, the range is 30 – 6 = 24.
From studying this example, you may notice that range reveals the distance between the set’s largest and lowest values. A larger range indicates more variability in distribution, while a smaller range indicates less variability.


Finding the range of a data set: Formula
An essential statistic, range, meaning maths, shows how far apart a data set is. It provides a concise overview of the data’s variability and is computed by finding the difference between the set’s highest and lowest values. By using this easy metric, you may learn a lot about the dispersion or clustering of the numbers.
When doing statistical analysis, the range is a great tool for spotting outlying (higher or lower than average numbers. The range formula may help you better grasp the distribution of your data.
How to find range? 3 easy steps
After familiarizing with range meaning maths students can use three simple steps to find the range of a set of numbers.
Step 1: Identify the maximum value: Carefully examining your data collection may reveal its values. The highest value is essential to calculate the range. When observing the set {3, 8, 15, 22}, 22 is critical because it is the highest value.
Step 2: Find the minimum value: The next step is to identify the smallest value, or lowest number, in the set. Since this number establishes the lower bound of your range, finding it is equally critical. In the set in step 1, the minimum value is 3.
Step 3: Subtract the two extremes: The third step in obtaining the range is to subtract the maximum and minimum values. Subtracting the values will give you the range, which indicates the degree to which the data varies. From the values in step 1, the range is 19, obtained by subtracting 3 from 22.
Range between two numbers
Judging from the range in math definition, you can calculate the range between two numbers by deducting the larger figure from the smaller one. This metric could be useful for comparing two numerical values, like distance or cost.
Teaching students the principle of range can be useful in calculating money. With this knowledge, they can easily compare the price of goods and make decisions.
You can tell a data set’s variability by looking at how far apart its values are. You need to know the range of two values to use distributions for comparison and evaluation.
How to compare data sets using a range?
Comparing data sets using range is one approach to measuring and understanding values and knowing range meaning math concepts. To determine the range of the data set, you need to subtract the highest and lowest values.
Before comparing the data sets, get a sense of their ranges. A larger range indicates data variability, while a smaller range indicates that the values are clustered around a single point. By comparing the ranges, you can tell which data set indicates greater variability or consistency.
For example, below are two data sets that record product sales data on an annual basis:
Data set 1: 1500, 1800, 2100, 1600, and 2000.
Data set 2: 1200, 1250, 1300, 1150, and 1400.
For data set 1, 2100 and 1500 are the greatest and lowest numbers, respectively. Subtract 1500 from 2100 to get 600. Because of this, the range of data set 1 is 600.
In the second data set, 1,400 and 1,150 are the highest and lowest numbers. Subtracting the two figures will get 250. Therefore, the range for this data set is 250.
As the example shows, data set 1’s 600 sales range is more variable than data set 2’s 250 sales range. Compared to the first set, whose sales statistics are variable, the second is more consistent. Such comparisons could be useful in product selection, developing marketing strategies, and analyzing trends.
How to find the range of a data set using graphs?
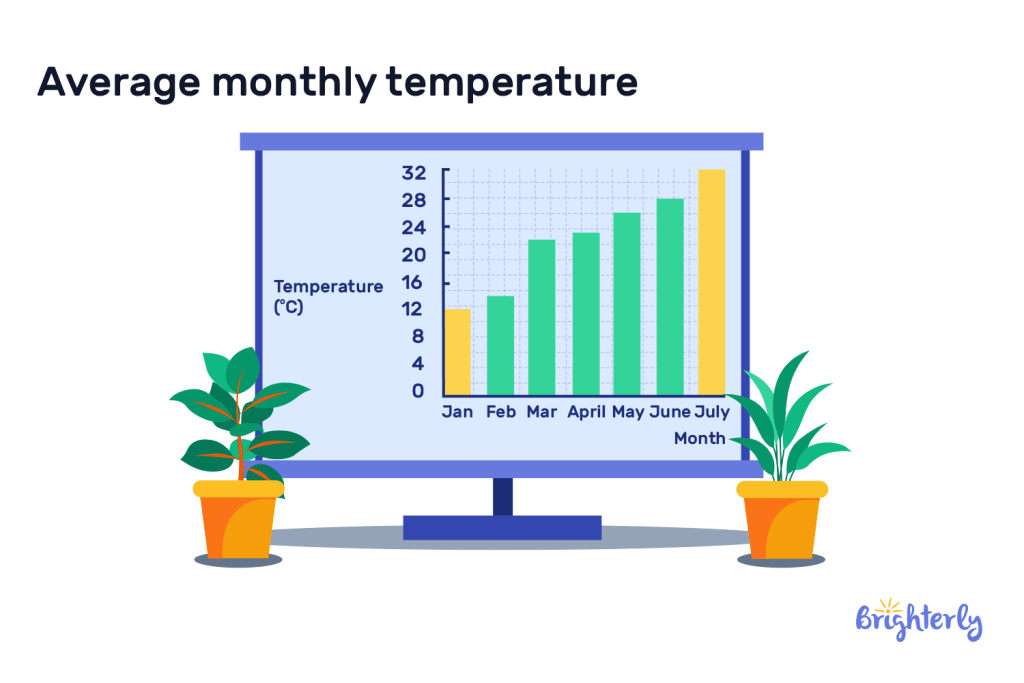
Graphs in range algebra provide a visual estimate of data sets to understand the data spread. You can find the dataset’s range by using box plots, histograms, or bar charts. Graphs improve understanding and presentation of findings by offering a visual way to examine and communicate data ranges.
Histograms also work here. Suppose you are given a 30, 45, 60, 75, and 50 data set as a series of monthly rainfall statistics measured in millimeters. The rainfall interval shown in a histogram’s bars might range from very minute to very long.
If the longest bar is 75mm and the shortest is 30mm, the range would be 45mm. The histogram helps in understanding the spread, variability, and distribution of rainfall.
Finally, you can use a bar chart to calculate the range. For instance, if the units sold across four stores — A, B, C, and D— are 200, 180, 220, and 150, respectively. A bar chart with varying bar heights will most commonly display the data. Just take the highest bar’s height (220) and subtract the lowest bar’s height (150) to obtain the range of 70.
Advantages or Merits of Range
One way of knowing range meaning in math is understanding its advantages. Below are some of these merits.
- Easy to calculate
- Easy measure for dispersing data
- Helps in comparing datasets’ variability.
Easy to calculate
Using the range algebra concept has several benefits, one of which is how easy it is to calculate. Finding the range is just finding the highest and lowest values in the data set and then subtracting them.
Range is easy to understand since it does not involve complex formulas, mathematics, or statistical expertise. By determining the range, you can quickly determine the variability between data sets.
The simplicity of range shines when you deliver fundamental statistical insights to a broad audience or do early data analysis where a rapid evaluation of data dispersion is required.
Easy measure for dispersing data
A range is a helpful concept for examining the value distribution inside a data set. Its purpose is to discover the most significant and smallest integers. A wide range of numbers between the two ends of the set indicates that the other numbers are spread out.
On the other hand, if the numbers are close together, they are similar. The range is a helpful tool for rapidly determining the degree of similarity or dissimilarity between two sets of integers.
Helps in comparing datasets’ variability
Using the range, you may quickly compare the dissimilarities between two sets of numbers. Examining the range of results will show you the difference between the lowest and highest scores in each data set.
When two sets of data are similar yet highly different, range analysis shows the dissimilarities between them. You may find out whether two sets of numbers are becoming spread or closer.
Limitations of Range
If you understand what range algebra means, the system makes sense. However, it also has certain limitations.
To begin with, range only considers the two extremes, ignoring the other numbers. If you are given the values 2, 3, 4, 5, and 10, the range would be 10 – 2 equals 8. Since the range is 8, it shows that most of the numbers are extremely close.
Another problem is when a number is much bigger or smaller than others. As an example, consider the following integer set: Subtracting 2 from 50 is 48. Given its outsized significance, 50 distorts the range for most numbers.
Although the range does provide some insight into the distribution of numbers, it does not provide a comprehensive view. If the numbers are very different or close together, it could be hard to make sense of them.
Range of a Function
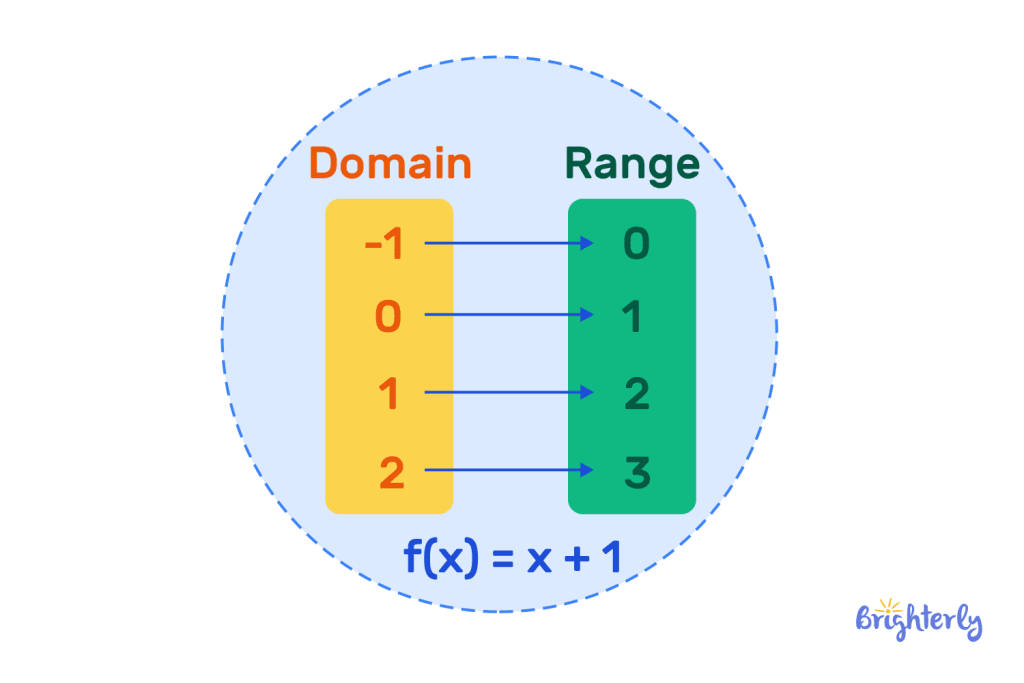
In range definition algebra 2, the range of a function is a fundamental idea that clarifies the set of potential values that the function may produce as an output value. An operation’s range is the set of all the various outputs it may generate when given an input.
One way to determine a function’s range is to look at the values it can generate when given various inputs. For example, function f(x)=x². If this function takes numerical values like -2, 0, and 3, it will return 4, 0, and 9 as outputs. Squaring any real number may only provide positive or zero values; hence, this function’s range encompasses all non-negative integers.
The function g(x)=sin(x), for instance, takes angle x as input and outputs between -1 and 1. Here, the function’s range encompasses all integers between -1 and 1 since that is the whole range of possible values for sin(x).
Knowing a function’s range when analyzing and graphing it is helpful since it indicates the expected output values.
How to find the range of a function from a graph
You may understand range definition math, but knowing how to find range from a graph is essential. You can see the range of a function by comparing its graphs—how high and low the graph goes.
A decent starting point is to look at the graph’s two high and low points. You can learn everything about the function’s potential values from these points.
For instance, if the graph goes up to 5 and down to –1, the values you need will be 5 and –1. It is not possible to determine the range without these numbers.
The range also includes any integer from the lowest to the highest. Here, the range will be from -1 to 5. Therefore, the function’s result may be anything from -1 and 5. The range of the function may be more easily determined when these graph extremes are identified.
Solved Math Tasks: Examples
Range math example 1
While on vacation, Jordan traveled to 8 different states and wrote down the price of each water bottle. What is the range of these water bottle prices?
The prices are, $3.2, $2.6, $2.5, $1.9, $2.4, $2.1, $2.0, $3.1, $2.9
Solution
Highest price: $3.2/ Lowest price: $1.9
| Range: $3.2 – $1.9 = $1.30 |
Range example 2
What is the range of the set of natural numbers less than 20?
Solution
Highest Number: 19/ Lowest Number: 1
| Range: 19-1 = 18 |
Range in Math: Practice Math Problems
Range in Math: Worksheets
Having now understood the range algebra definition and how to calculate the range of numbers in different contexts, it’s time for you to look into other applications of range in mathematics. Check out Brighterly’s worksheets for further help.


Math & reading from 1st to 9th grade
Looking for homework support for your child?

Choose kid's grade
Math & Reading for Grades 1–9
Build real confidence for your child with a Brighterly math or reading tutor.