Graphing Inequalities Worksheet
Updated on December 25, 2025
For those who are ready to work through new math challenges, we developed graphing inequalities worksheets. We bet solving inequalities is simple. However, knowing how to draw them on a coordinate plane can be sketchy. These sheets will help practice (and master!) shading the correct region and choosing the right boundary line.
Graphing inequalities worksheet PDF: Examples
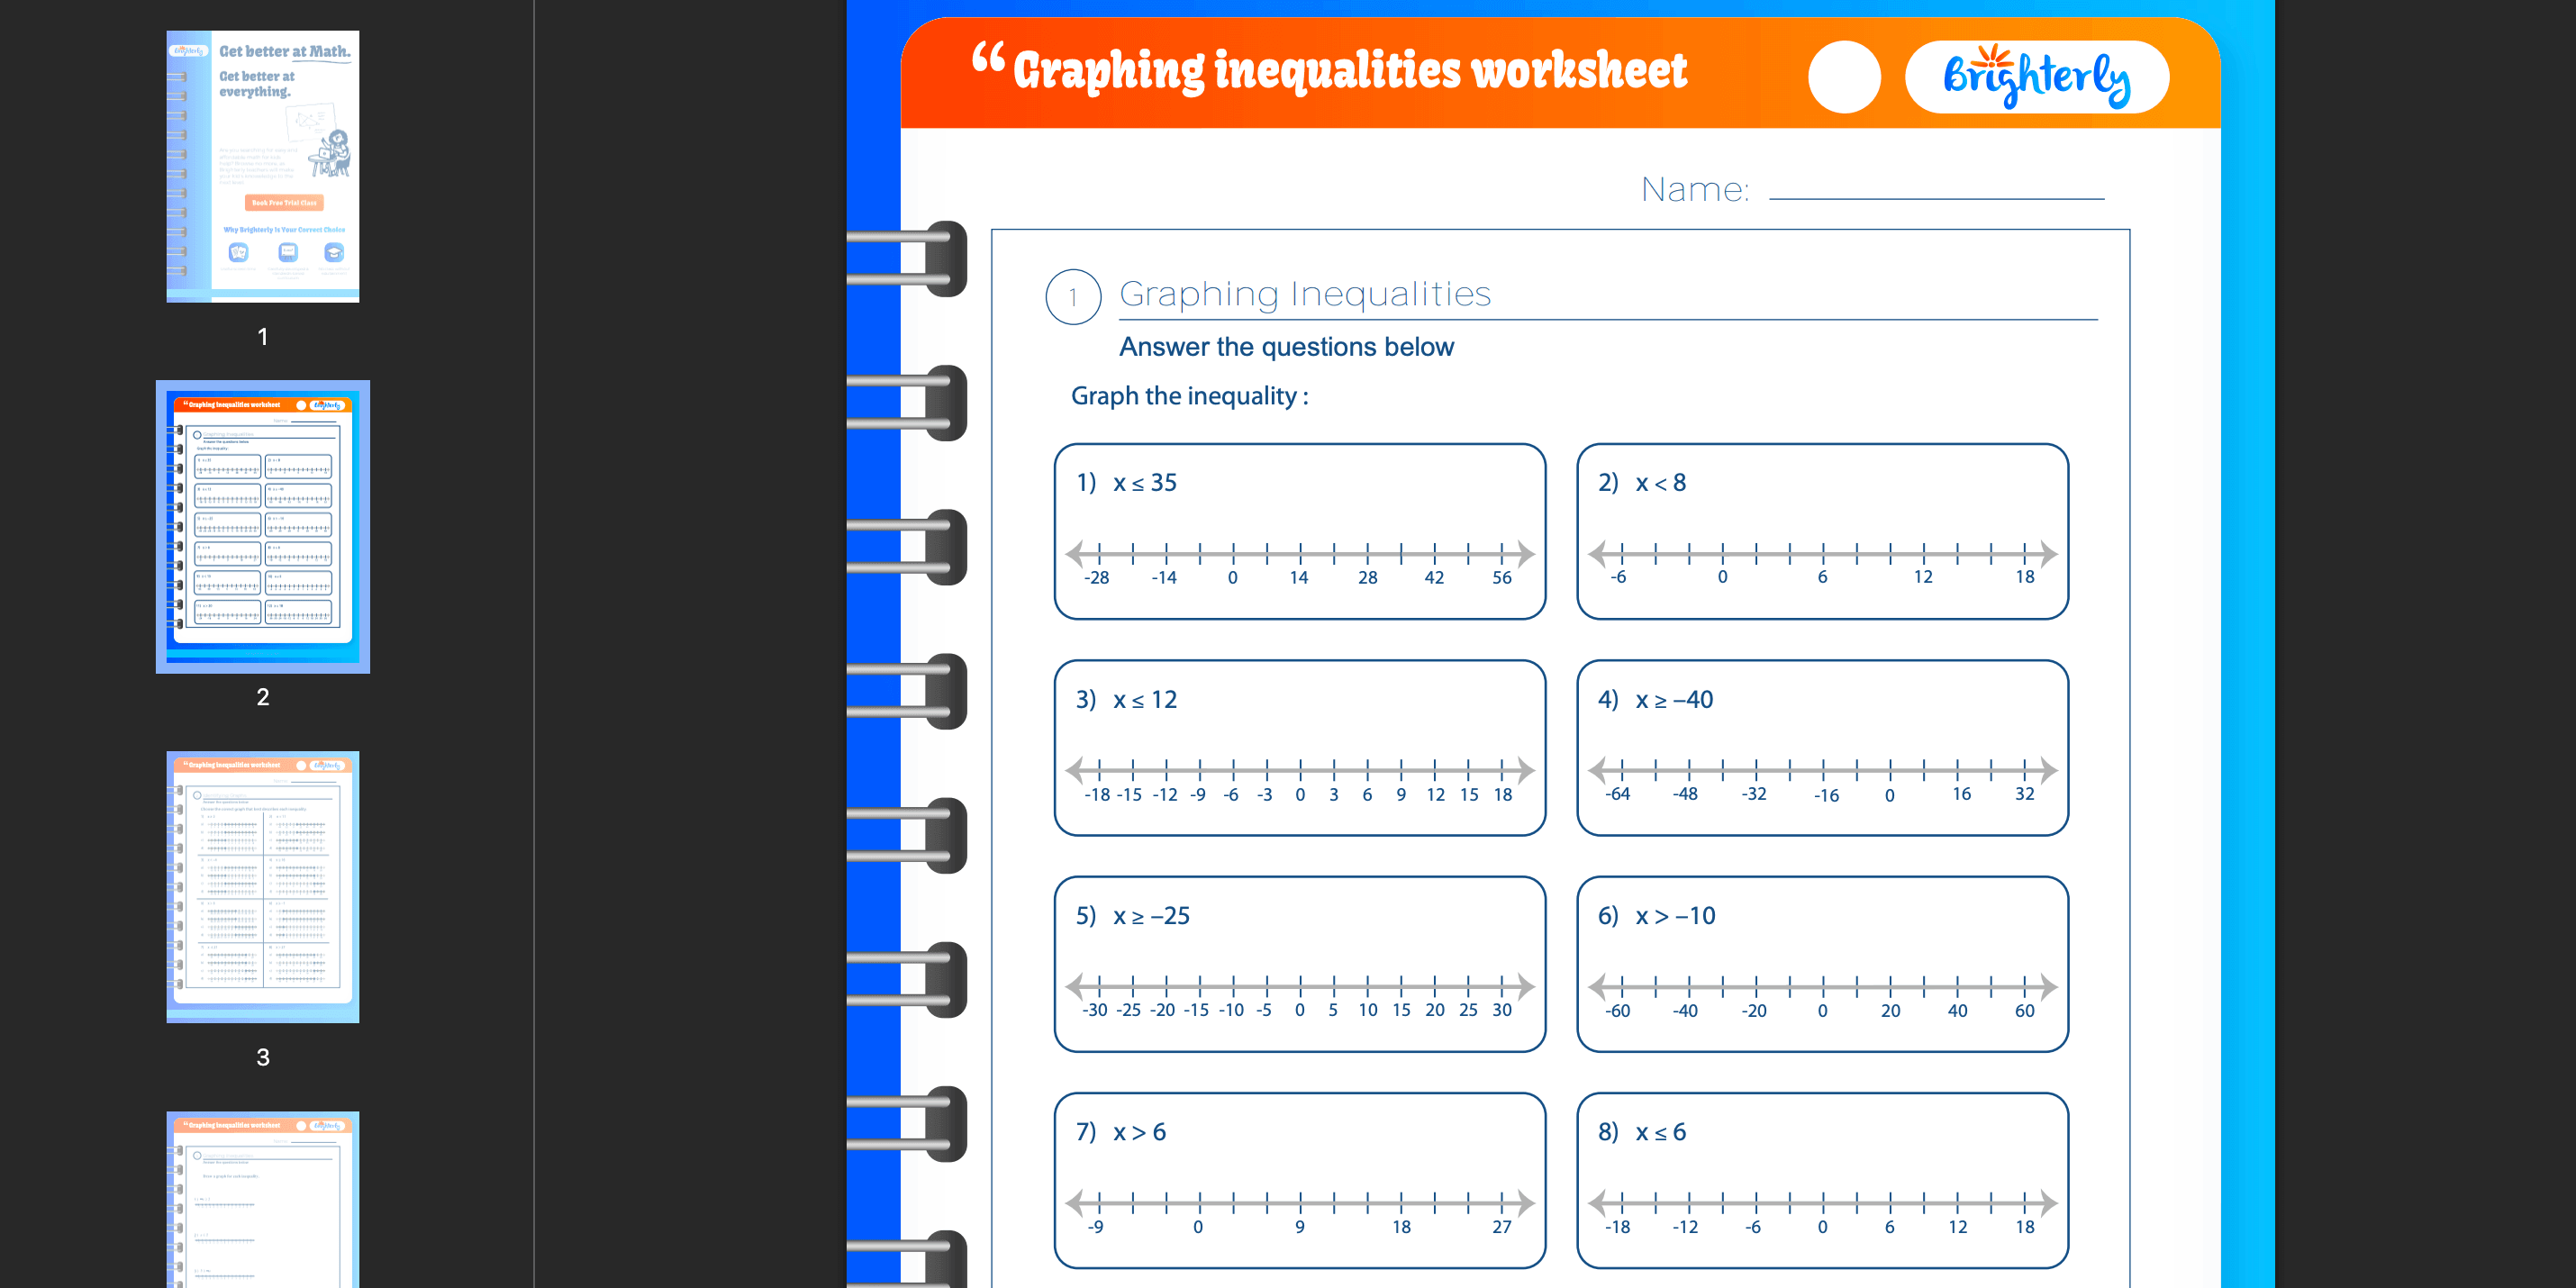
Our Graphing Inequalities Worksheet PDF with answers is the perfect way to confidently visualize algebra. To master how to visualize solutions where more than one number works, students are expected to regularly practice plotting the boundary line and shading the correct half-plane. Step by step, they’ll solidify the concept that inequality solutions aren’t single points but areas.


Help your child reach their full potential!
Answer a few quick questions about your child’s learning, and we’ll recommend next steps.
Graph inequalities worksheet: Free download
We know practice is key. So, don’t wait and grab your free download. They include all the focused problems your student needs to master boundary lines and shading.
More graph worksheets
- Lines and Angles Worksheets
- Systems of Linear Inequalities Worksheet
- Rational and Irrational Numbers Worksheets
- Linear Equation in One Variable Worksheets
- Solving Equations with Variables on Both Sides Worksheets
Want to get even better at graphing? Practice makes progress. Go ahead and check out other worksheets to support you on that path.
Benefits of writing inequalities from a graph worksheet
- Visualizing inequality solutions
- Learning correct graph shading
- Mastering boundary line rules
- Understanding half-plane selection
- Avoiding common sign mistakes
Inequalities and their graphs worksheet answers to visualize inequality solutions
One big benefit is seeing the math come alive! Using a graphing inequalities worksheet answer key helps students visualize that an inequality has many solutions. The more they plot the boundary line and shade the correct region, the clearer students understand which values satisfy the problem. In such a way, they’re getting a much clearer picture of the algebraic solution set.
Note: Studies state that using algebraic visuals enhances students’ conceptual reasoning. It enables them to effectively translate abstract equations and inequalities into concrete, solvable relationships.
Graphing inequalities practice worksheet for learning correct graph shading
Another benefit of the graphing inequalities worksheet is a value-focused training to master shading. Shading correctly shows the entire area of possible solutions. These worksheets give students targeted practice in testing points. They also are to decide which side of the boundary line (or curve) to shade.
Graphing inequalities worksheets help master boundary line rules
It’s important for kids to work on deciding whether to use a solid line (when the inequality includes ‘or equal to’) or a dashed line (for strict inequalities). Due to our exercises, they learn to quickly link the inequality symbol to the correct line type.
Note: Mastering the line type stops a common math error: Treating an inequality like a basic equation! The solid or dashed line confirms your solution is a whole region. And that’s a huge conceptual step!
Graphing inequality worksheet for understanding half-plane selection
A graphing inequalities on a coordinate plane worksheet is the best way to practice selecting the correct half-plane. This is where kids learn to pick a test point. Usually, it’s the origin, if it’s not on the line. And then, they plug it into the inequality. This process clearly shows them which side of the line holds the solutions. And which side doesn’t.
Graphing inequalities worksheet helps avoid common sign mistakes
The graphing linear inequalities worksheet is a great defense against common mistakes, including a misreading intercept. Or, since kids must translate the inequality sign into visual rules (e.g., choosing a solid or dashed line and deciding which way to shade), they practice connecting the math symbol to the graph. This constant review helps students avoid far too often confusing the ‘greater than’ symbol with the ‘less than’ symbol.
Note: Other common struggles among students include manipulating negative coefficients in inequalities and making frequent errors with inequality symbols. Visual graphing practice helps with that as well!
Inequalities graphing worksheet and tests: Practice
Our inequality graphing worksheet collection gives kids the deliberate practice indispensable for mastering shading and boundary lines.
After building those skills, you can use our math tests to check progress. These tests are great for confirming mastery before moving on.

To download all the relevant practice exercises and tests, you can visit Brighterly’s 9th Grade Math Worksheets page!


Need help with Numbers?

- Is your child having difficulties with understanding numbers?
- An online tutor could provide the necessary support.
Choose kid's grade
Does your child struggle to grasp the concept of numbers? Try lessons with an online tutor.
Book FREE lesson