Standardized Testing Statistics 2026
reviewed by Jo-ann Caballes
Updated on December 27, 2025
After the No Child Left Behind Act (NCLB) was passed (2002) and updated (2015), tests became a nationwide practice with the public standardized testing statistics results. But isn’t there too much testing at schools? Are they good? Let’s unpack the state of standardized testing in 2025-2026.
Key points
- Standardized tests are pre-set exams for measuring student performance grade by grade.
- The most common examples of standardized tests are the American College Testing (ACT) and the Scholastic Aptitude Test (SAT).
- According to standardized math testing statistics PDF files researched, student performance has worsened since the pandemic and is not improving dramatically.
- The common test structure is multiple-choice and true/false quizzes, which may not adequately evaluate all the students taking them.
- Notwithstanding some criticism regarding standardized testing cons statistics, diagnostic math tests are still highly effective in tracking progress and improving math skills.
What are standardized tests? Definition and purpose
Standardized tests are part of the US assessment campaign that helps educators evaluate students’ academic performance and compare their results nationwide. Thanks to a consistent, uniform scoring system, standardized testing collects information about the knowledge and skills of students in selected subjects and lets us draw conclusions regarding overall school academic performance in a country.
Given these specifics, the question of “Is standardized testing effective?” arises, as uniformity of the examination cannot combine with revealing the depth of knowledge and the unique story of each student taking an exam.
“Standardized exams are written to take students' performance on a specific exam and get large-scale data about the specific student's performance relative to the others.”
Usually, the comparative factor is more important than depth of knowledge; thus, parents should keep in mind that standardized test statistics show how their child performs compared to peers. It may not reveal their individual peculiarity or demonstrate their real understanding of the subject.
Statistics about standardized testing in the US
Standardized testing statistics 2021-2022 |
Standardized testing statistics 2023 |
Standardized testing statistics 2024 |
Standardized testing statistics 2025 |
| SAT Report 2021: Over 1.5 million students took the SAT, with a math mean score of 528. 49% of students met math college readiness benchmarks. | SAT Report 2023: Over 1.91 million students took the SAT, with a math mean score of 508. 42% of students met math college readiness benchmarks. | SAT Report 2024: Over 1.97 million students took the SAT, with a math mean score of 505. 41% of students met math college readiness benchmarks. | SAT Report 2025: Over 2 million students took the SAT, with a math mean score of 508. 41% of students met math college readiness benchmarks. |
| SAT Report 2021: The Evidence-Based Reading and Writing (ERW) mean score is 533, with 67% of students meeting the college readiness benchmark. 46% of students took the essay. | SAT Report 2023: ERW mean score is 520, with 62% of students meeting the college readiness benchmark. 14% of students took the essay. | SAT Report 2024: ERW mean score is 519, with 62% of students meeting the college readiness benchmark. 13% of students took the essay. | SAT Report 2025: ERW mean score is 521, with 64% of students meeting the college readiness benchmark. 13% of students took the essay. |
|
Graduating Class: Over 1.3 million students took the ACT, with a composite score mean of 19.8. |
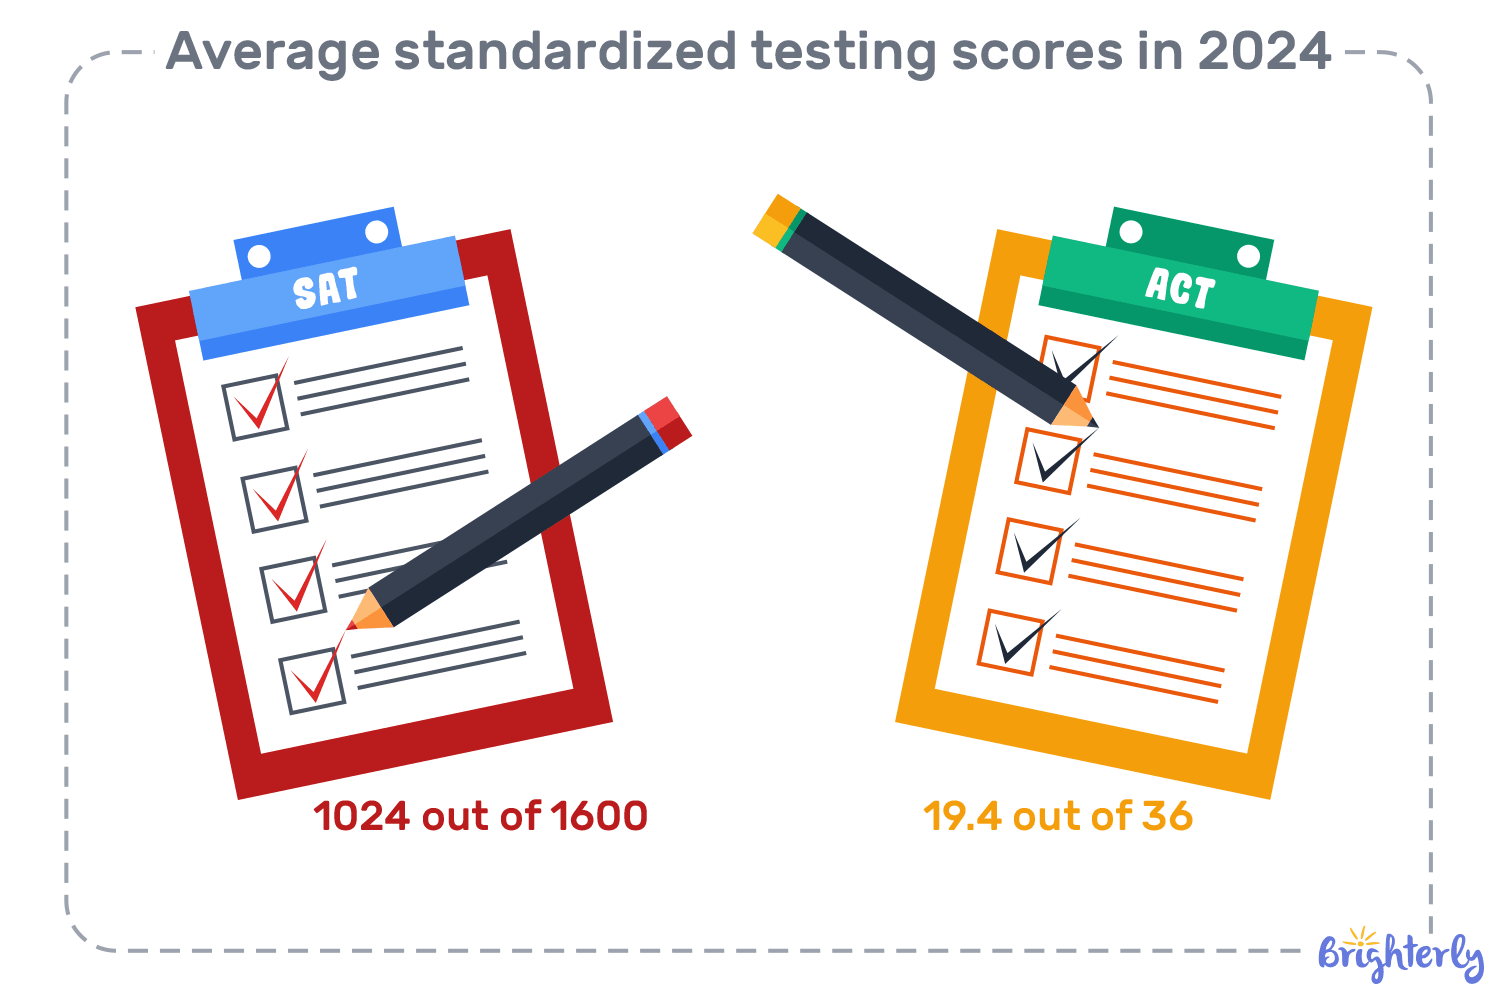
2023 ACT-tested Graduating Class: Over 1.3 million students took the ACT, with a composite score mean of 19.5. | 2024 ACT-tested Graduating Class: Over 1.3 million students took the ACT, with a composite score mean of 19.4. | 2025 ACT-tested Graduating Class: Over 1.3 million students took the ACT, with a composite score mean of 19.4. |
| Based on the ACT 2021 results, 36% of math and 44% of reading students met the college readiness benchmark. | Based on the ACT 2023 results, 30% of math and 40% of reading students met the college readiness benchmark | Based on the ACT 2024 results, 29% of math and 40% of reading students met the college readiness benchmark | Based on the ACT 2025 results, 29% of math and 39% of reading students met the college readiness benchmark |
Key points from national standardized testing statistics
- As for 2025-2026, only two out of five math students meet math college readiness benchmarks upon completing the SAT, and the ACT score mean shows a declining trend.
- The number of students meeting college reading benchmarks is usually higher than those who meet them in math, but the results are the trend is also declining.
- In spring 2020, the schools were closed and standardized assessments were postponed nationwide. As a result, after the COVID-19 pandemic, the number of students taking the SAT test dropped from 2.1 million in 2020 to 1.5 million students in 2021. Further, based on the pandemic learning loss statistics, less than 2 million students took SAT test in 2023 and 2024.
- The number of students who took SAT in 2025 is almost reaching pre-pandemic times.
- The 19.8 national average ACT score in 2022 was the lowest in more than 30 years, and it becomes lower year by year.
- If we consider college readiness the rate of test success, the number of how many students fail standardized tests each year is between 30% and 60% of students.
- Based on The Nation’s Report Card results in 2024 (2024 NAEP), only grade 4 students slightly increased their math average score. Grade 8 students showed the same results.
- In 2022, the NYT reported that less than 38% of grade 3-8 students demonstrated proficiency in math. Prior pandemic learning loss, this number was around 46%. In 2024, NYC test results in public schools demonstrated 53.4% proficiency (an increase of 3.5% compared to 2023).
“Although not perfect, the SAT and ACT are very accurate standardized exams.”
Standardized testing statistics by state (2024-2025)
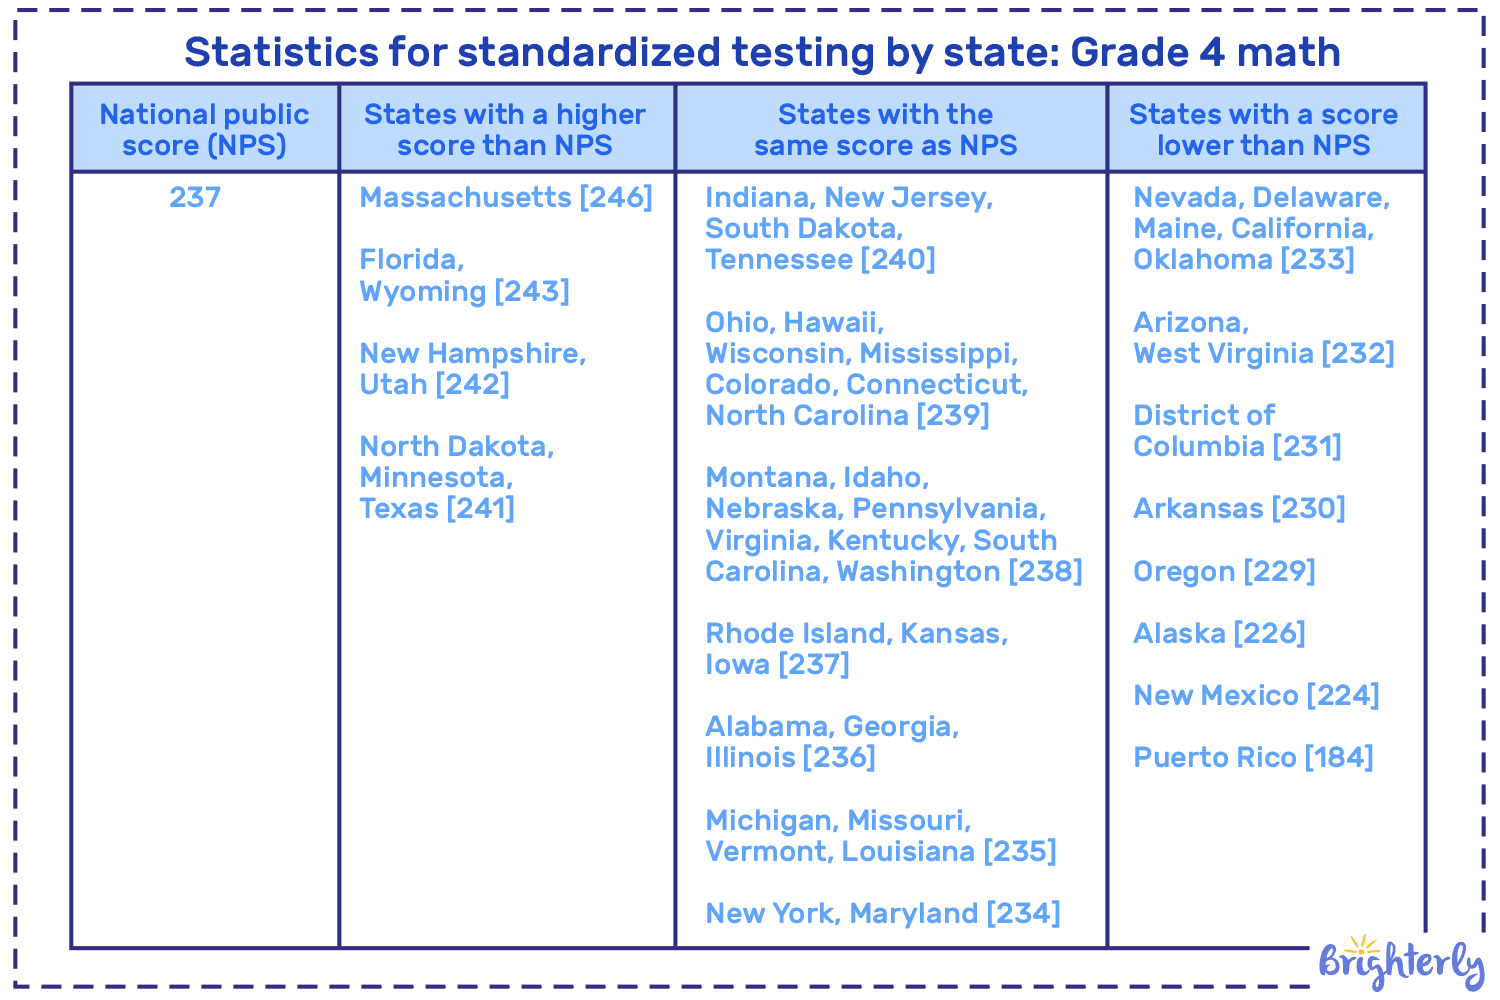
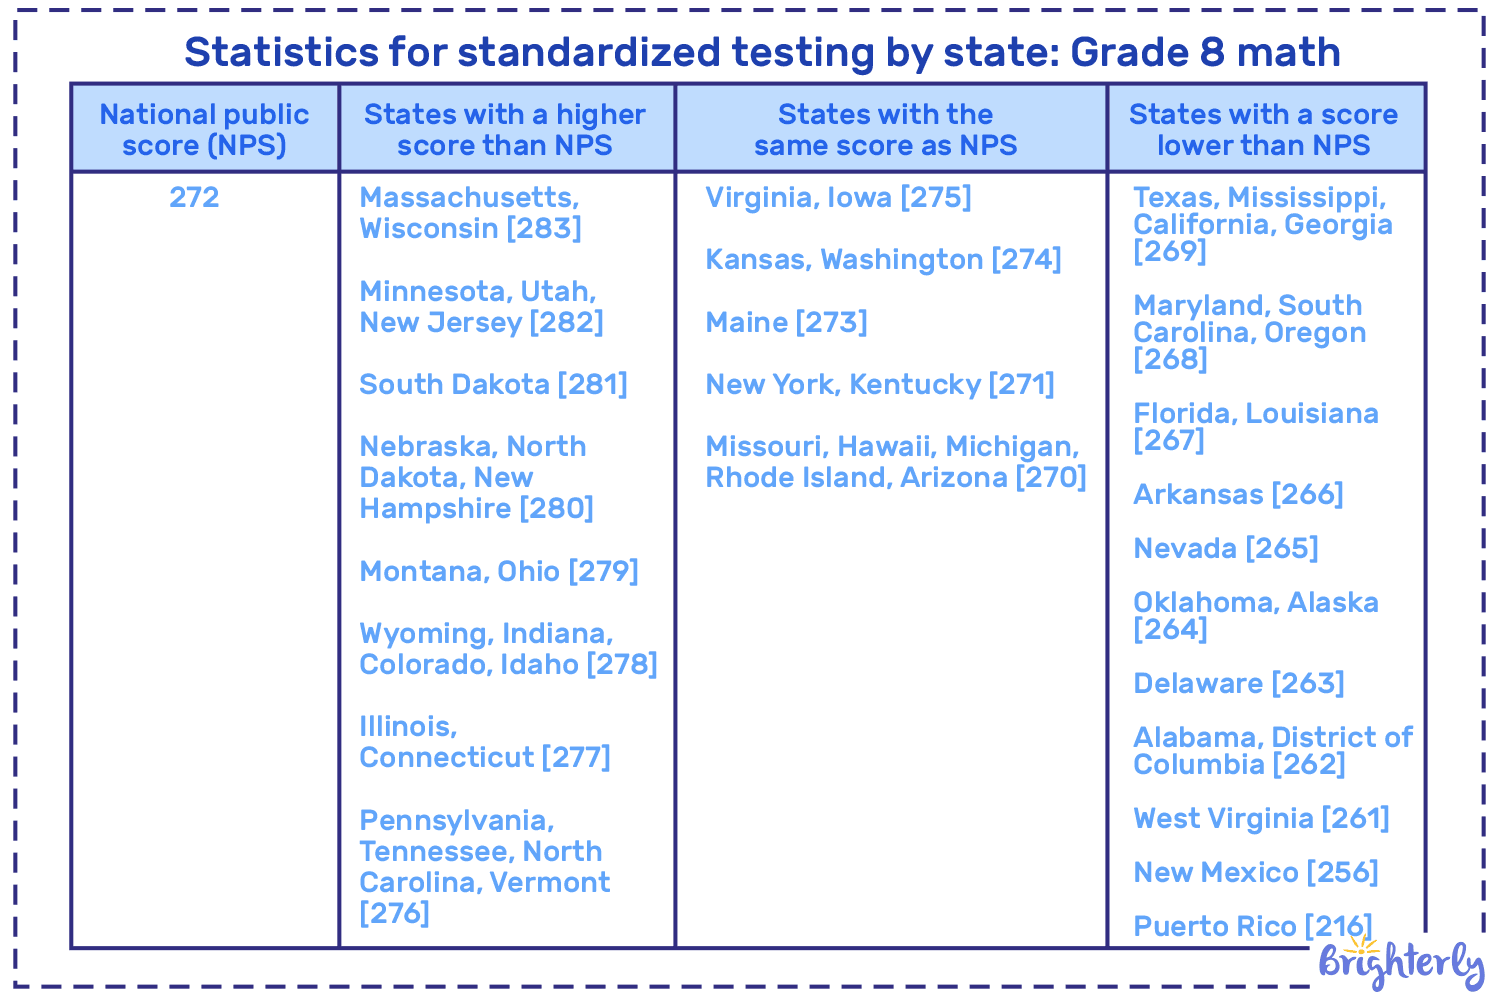
As the NYC testing results show, some states managed to cover the pandemic math learning loss and even improve it. In the table below, you can see the detailed standardized testing statistics 2025 by state. The results are presented for grade 4 and grade 8 students based on the 2024 NAEP data and grouped based on state performance: higher, same, or lower than the national public score (NPS) levels.
Statistics for standardized testing by state: Grade 4 math
Statistics about standardized testing by state: Grade 8 math
Did standardized tests statistics by state change in 2025?
Based on the 2025 SAT and ACT test results, the overall math and reading performance has not dramatically changed after 2024, so you can rely on the data for 2024-2025.
Below, you can see the top 10 states that tested 99%-100% of their students, based on the composite score for the ACT 2025 results:
- Nebraska: 19.2
- Wyoming: 19.1
- Tennessee: 18.8
- Kentucky: 18.4
- Louisiana: 18.3
- Alabama: 18
- Mississippi: 17.7
- Arizona: 17.7
- Oklahoma: 17.5
- Nevada: 17.2
Note that these results are preliminary, and while other states may have higher average ACT composite score, the percentage of tested graduates is usually lower in such cases.
Statistics of standardized testing by school (revised with social disparities considered)
In standardized testing practice, the equity and accessibility issues are extremely sharp, meaning the contrast of results between high-income white/Asian students and low-income Black/Hispanic students. Thus, a more realistic picture of the overall statistics about standardized testing in the US can reveal itself once we consider the learning style and access to the standardized testing language of the students.
“Standardized tests are written in such a specific style and manner that is unusual for students and is different than how we usually speak.”
To compare the difference, below are two tables on the top 10 schools in 2024 based on the US News data. Both show the ratings based on the proficiency rates for math and reading: one is for all students, and the one is for underrepresented students, meaning Black, Hispanic, and/or from low-income households.
Top 10 schools based on math and reading test scores (all students)
State |
Number of schools ranked |
Schools ranked in top 25% nationally |
| Massachusetts | 351 | 43.9% |
| Connecticut | 198 | 42.9% |
| New Jersey | 406 | 42.1% |
| Maryland | 210 | 39% |
| Florida | 647 | 37.4% |
| Montana | 38 | 36.8% |
| California | 1,652 | 35% |
| District of Columbia | 33 | 33.3% |
| New York | 1,210 | 32.1% |
| Colorado | 334 | 31.4% |
Top 10 states based on math and reading test scores (underrepresented students)
State |
Average proficiency |
Top school in the state |
Top school national rank |
| Virginia |
68.9% |
Thomas Jefferson High School for Science and Technology | 14 |
|
Maine |
58.1% | Greely High School | 566 |
| Mississippi | 52.3% | Ocean Springs High School | 682 |
| New York | 50% | Queens High School for the Sciences at York College | 25 |
| Iowa | 48% | West Senior High School | 626 |
| Pennsylvania | 46.4% | Julia R. Masterman Secondary School | 4 |
| Texas | 43.6% | The School for the Talented and Gifted | 6 |
| Connecticut | 43.4% | Connecticut IB Academy | 117 |
| Colorado | 40% | D’Evelyn Junior/Senior High School | 59 |
| Massachusetts | 39.4% | Boston Latin School | 27 |
Statistics on why standardized testing is bad: Extra disparities across students
Based on the studies on standardized testing, there can be some non-obvious factors that may affect the results and cause more disparities. For example, the tests favor combinations of specific skills over others, which affects what we consider as college-ready math or reading proficiency.
“There are many students who know most of the concepts and rules on a test like the SAT, but cannot apply those rules in the various tricky ways presented on a standardized test.”
Based on this, Stanford University’s professor Sean Reardon found out that the standardized testing format is 25% more comfortable for girls than for boys due to the skills required to pass the test (including constructed-response tests, handwriting skills, preference for multiple-choice over open-ended questions, etc.).
In this regard, the ability to focus can be more determining than any other set of skills for nailing tests and revealing true knowledge of the subject.
“Many students are struggling to maintain focus for a long enough period of time to perform well on standardized tests.”
How many students take standardized tests each year?
Around 1.3-2 million students across the US take standardized tests like the SAT and ACT each year.
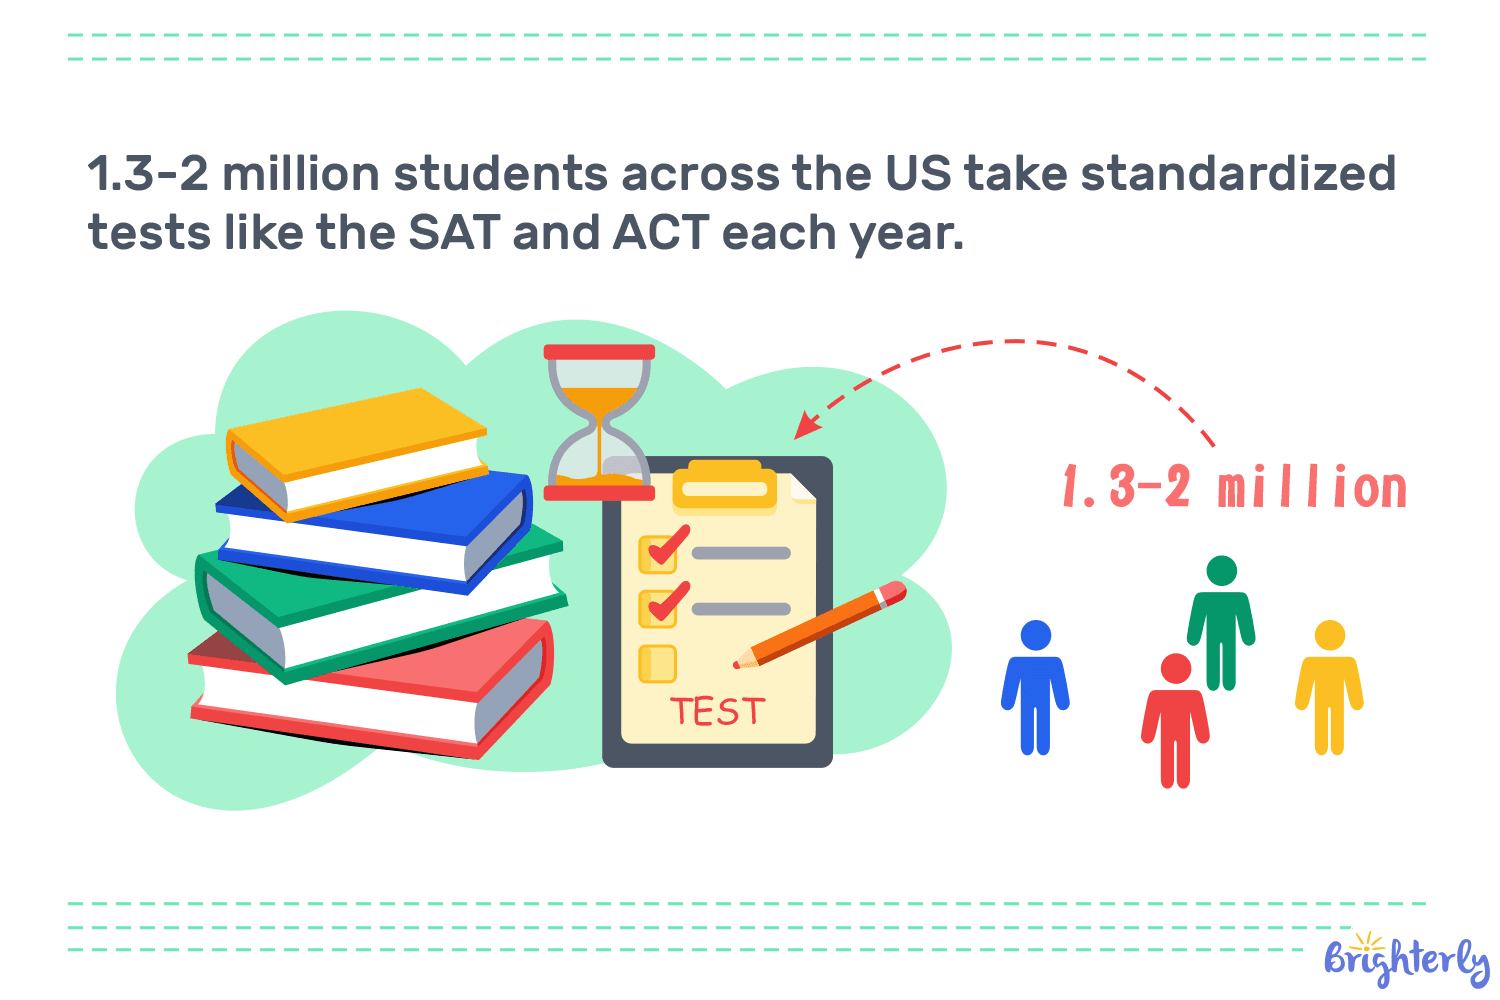
Based on the SAT Suite of Assessment Annual Report data, 1.9 million students took the SAT in 2024 and over 2 million students took standardized tests in 2025.
Statistics on standardized testing in the United States of America
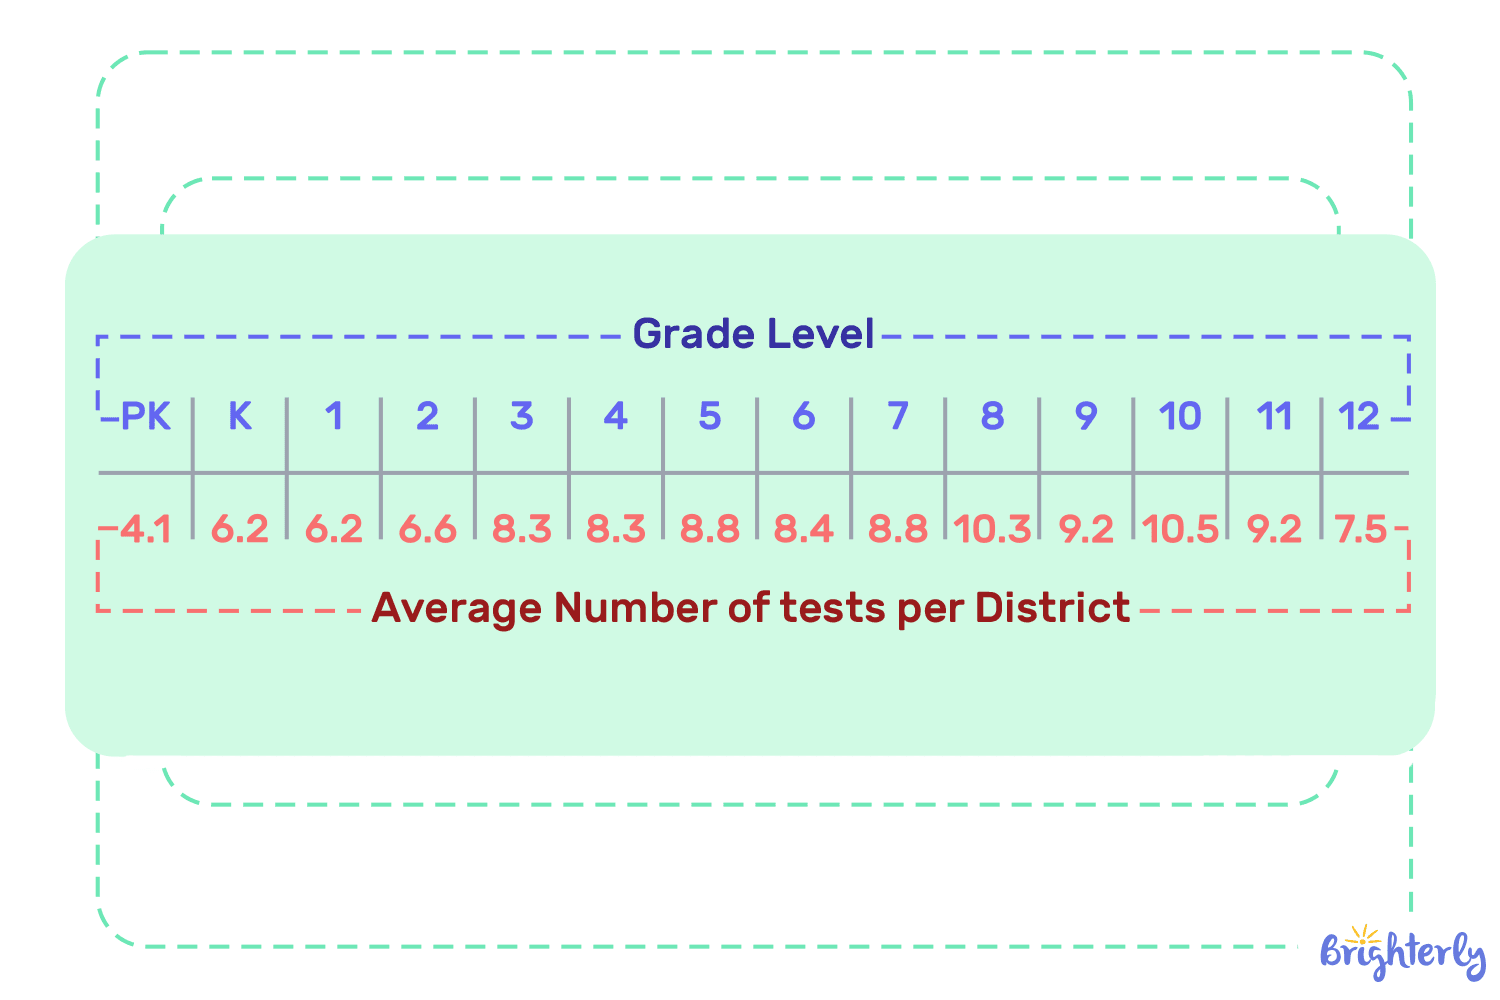
Based on the statistics of how many standardized tests do students take, an average student between pre-K and grade 12 takes around 112 standardized tests, with around 10 tests throughout the year in grades 3-8.
Back in 2014, the Center for American Progress found out that urban school students spend around 17 hours taking district-level exams, which is up to 266% more time compared to students from suburbs, and proving statistics about standardized testing being bad and harsh on students.
How much does it take to pass some standardized tests in the United States?
Based on the exam announcement on the statistics on standardized testing in America
information, the average time to pass one standardized test is around 2-3 hours:
- AASA (Arizona), March 31 – April 25, 2025: 60-90 minutes for writing part, two 45-75 minute sessions for reading, and two 60-85 minute test sessions for math.
- SAT: two 32-minute modules for reading and writing, two 35-minute modules for math.
- ACT: two hours since 2025 (three hours before)
Note: After the NCLB was implemented, 23 states expanded their assessment programs to meet federal law requirements and introduce tests for grades that were not previously assessed. Since then, NAEP and the Council of Chief State School Officers (CCSSO) were formed, helping some schools cover the gap in standardizing tests and implementing them.
What percentage of students struggle with standardized tests?
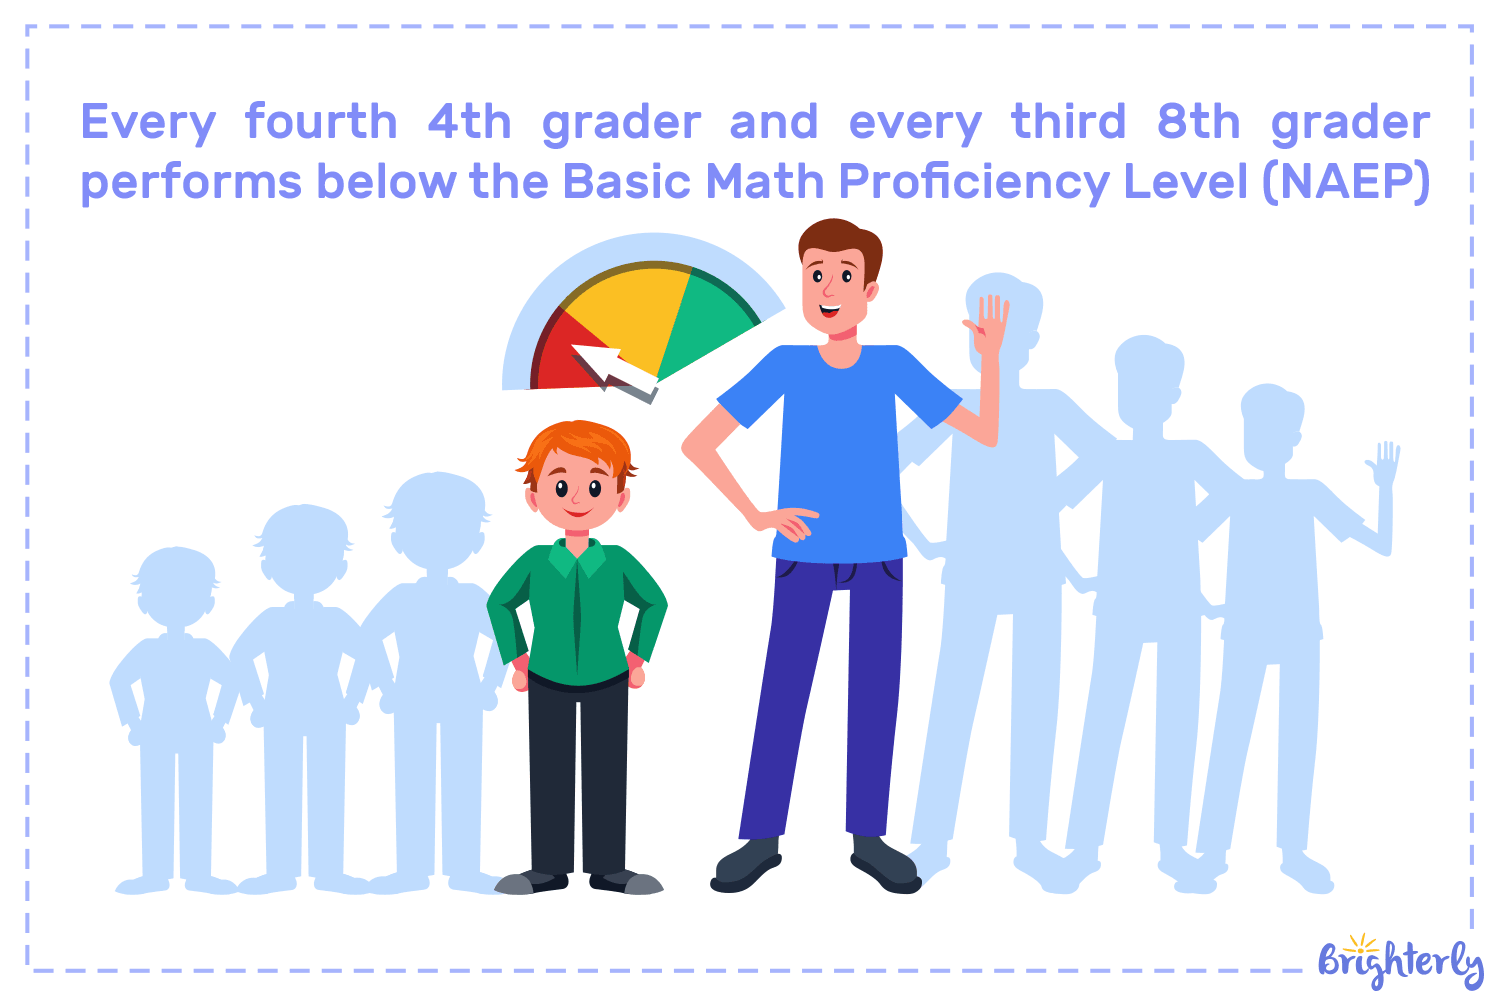
The majority of students struggle with standardized tests. Based on 2024 NAEP Results, only 39% of 4th grade students and 28% of 8th grade students performed at or above the Proficient Level. 24% of 4th and 39% of 8th graders performed below the Basic Level.
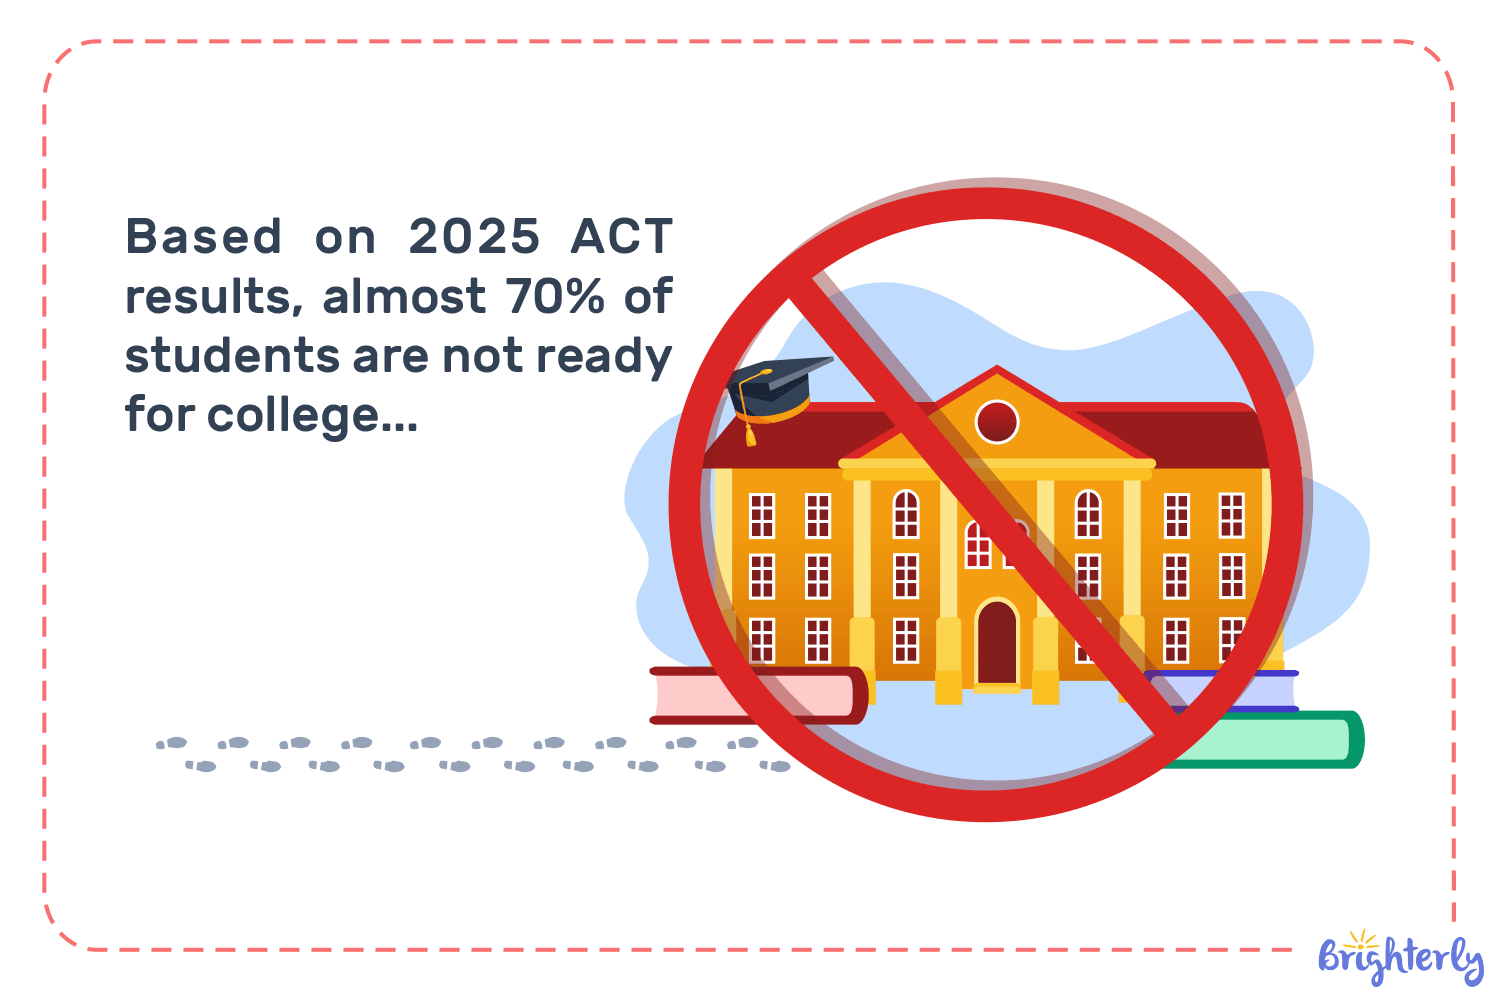
2025 SAT assessment showed that, although the test participation is steadily recovering to pre-pandemic level, as in 2024, only 39% of standardized test takers met or exceeded readiness benchmarks in the Evidence-Based Reading and Writing and Math.
In 2024 and 2025, the 19.4 average ACT composite score became the lowest in over 30 years. Only 30% of graduates met three or four ACT’s readiness benchmarks for colleges (English, math, reading, science) and only 57% met at least one benchmark.
Support with reading and math skills for standardized testing for elementary, middle, and high school students
Struggling in a reading or math class is a common practice these days in the US schools. Considering the common testing anxiety and learning gaps the pandemic learning loss caused, it’s important to constantly practice and improve math skills to keep on track and pass such tests successfully.
Statistics on standardized testing: Several tools to work with
- Regularly pass diagnostic tests during the standardized testing preparation
- Constantly cover learning gaps with tailored worksheets for each problematic subject
- Start practicing with a personal tutor who is an expert in standardized testing preparation
Brighterly reading and math tutoring platform covers all these measures for your kid
Once you start working on statistics on standardized tests with school-supplemental resources like Brighterly math and reading platform, you can expect these helpful tools from him:
- A set of diagnostic tests to help identify math learning gaps timely.
- Helpful guides, reading worksheets and math worksheets with ready-made tests to prepare for any exam and gain confidence to pass it.
- Personalized tutoring with experts, with a 4.4 satisfaction score on Trustpilot among over 200,000 satisfied parents.
Try for free a reading test and math tests 1-9 from Brighterly today to make the first step towards covering your kid’s math learning gaps.
“The most effective strategy to feel prepared and confident for standardized tests involves taking a diagnostic test to establish a baseline score.
Free diagnostic tests [grade 1-9]
| 1st grade math test | 4th grade math test | 7th grade math test |
| 2nd grade math test | 5th grade math test | 8th grade math test |
| 3rd grade math test | 6th grade math test | 9th grade math test |
Also, you can request personalized coaching from Brighterly, the most effective tool for standardized testing support. During 1:1 sessions with reading tutors and math tutors, your kid will be covering learning gaps faster compared to practicing with templates and in group sessions or math classrooms. Request a free lesson from a Brighterly math tutor for your kid so they can start preparing for tests regularly at an affordable price from 17.3/lesson right now.
If you’re limited on budget, you can still boost your kid’s math, reading, and writing level and help them pass any test with custom worksheets for specific subjects — for example, addition without regrouping or idioms.
Why standardized testing is good (statistics)
The key factors supporting statistics about standardized testing being good are their predictability for students and relative objectivity for educators and policymakers.
How does standardized testing help students?
With a predictable schedule of tests, students can plan their effort and get more control over their education.
How does standardized testing improve education?
With objective assessment and hard data, the education system can clearly see the situation with academic performance nationwide.
Facts about standardized testing
- Shows the areas of students’ improvement
- Helps to set benchmarks to track progress
- It’s a good prep for future tests in adult life
- Spots systematic problems in schools, states, and countries
- Minimizes the subjective grading risks
- Facilitates analysis and acting on educational problems
- Keeps kids busy preparing for the exams and passing them!
Source: Center for American Progress
What is the biggest issue with standardized testing?
The biggest issues with standardized testing are that tests deepen social disparities and teach kids to concentrate on getting a good grade rather than enjoying the learning process.
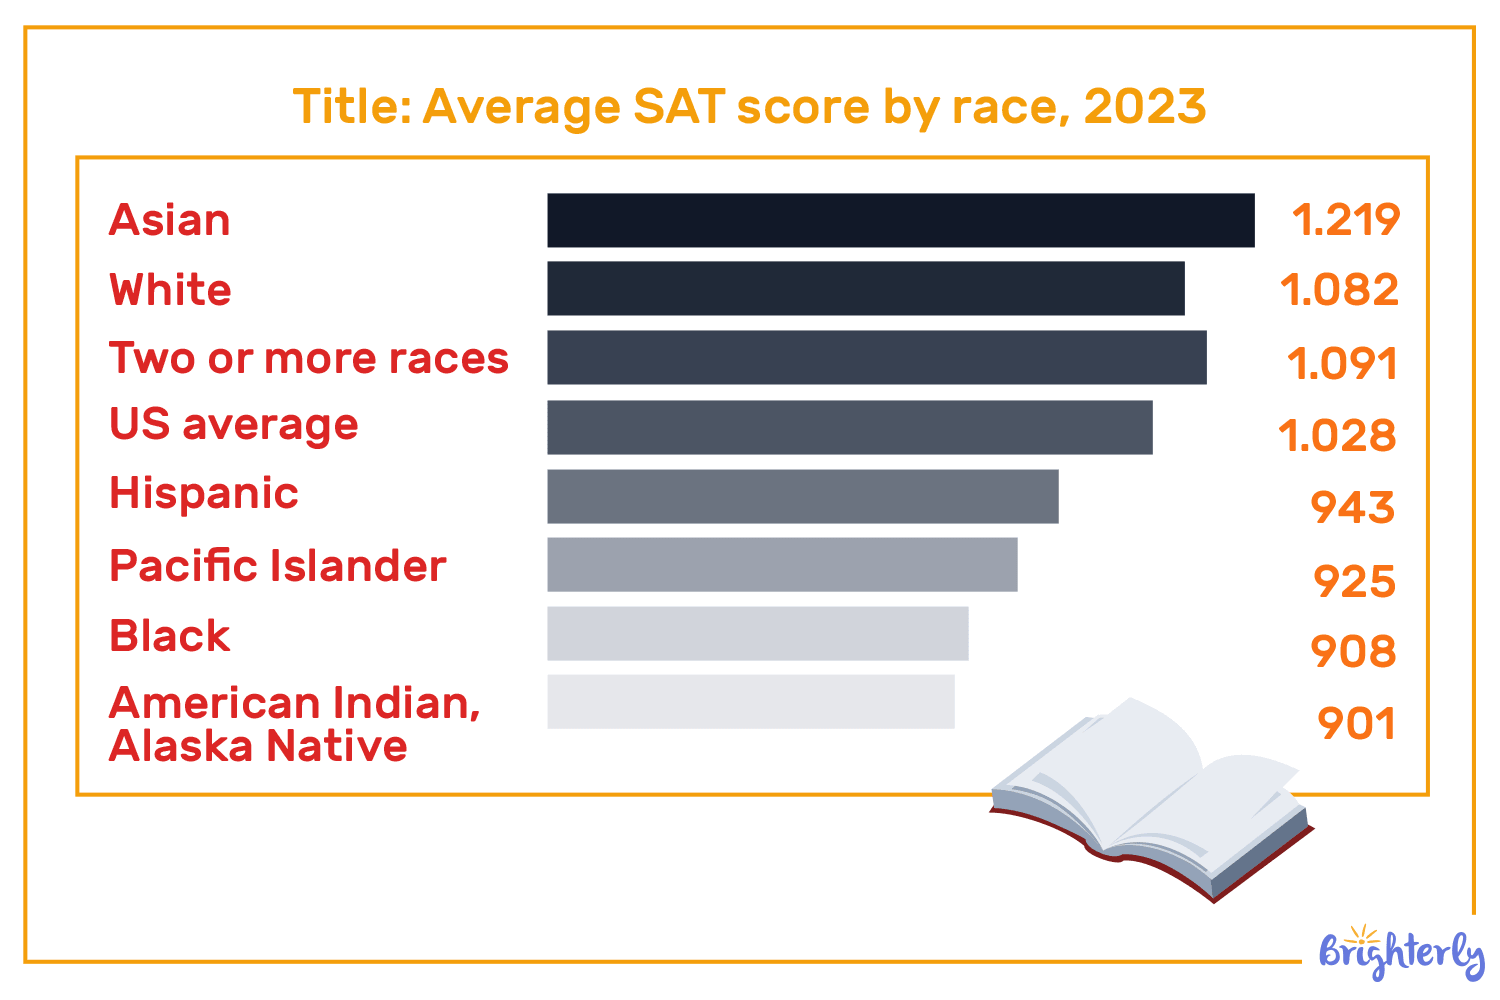
Racial disparities are the most illustrative statistics on why standardized testing is bad. Based on the National Center for Education Statistics, Asian and White students demonstrate better average SAT scores than other races year by year, from 2017 to 2024.
Negative standardized testing statistics: Do tests help children learn?
Based on the current US education trends statistics, the negative standardized testing effects raised the national debate. Parents and educators raise more doubts on whether taking test after test is an accurate tool for learning and absorbing information.
Project-based learning as an alternative to standardized testing
As the Washington Post noted, project-based learning is getting more popular in current research on standardized testing and seems more relevant to the current standardized learning challenges. In particular, it lets students dive deep into a selected project instead of chasing superficial bits of facts to pass the test.
Note: While good on paper, this approach becomes problematic once students fail to close projects successfully and change them timely — the problem that standardized testing pros statistics successfully solves.
Better test structure as a possible solution to common standardized testing problems
Another approach to learning as an alternative to standardized testing is changing the standardized tests themselves. The one-size-fits-all testing doesn’t take into account the differences in the learning styles of students and the resources from schools.
Standardized testing and mental health statistics
Based on the standardized testing stress and anxiety statistics, 13%-70% of students experience the symptoms of test anxiety, with every third student experiencing high test anxiety that is functionally impairing and causing concentration reduction and slow cognitive functioning.
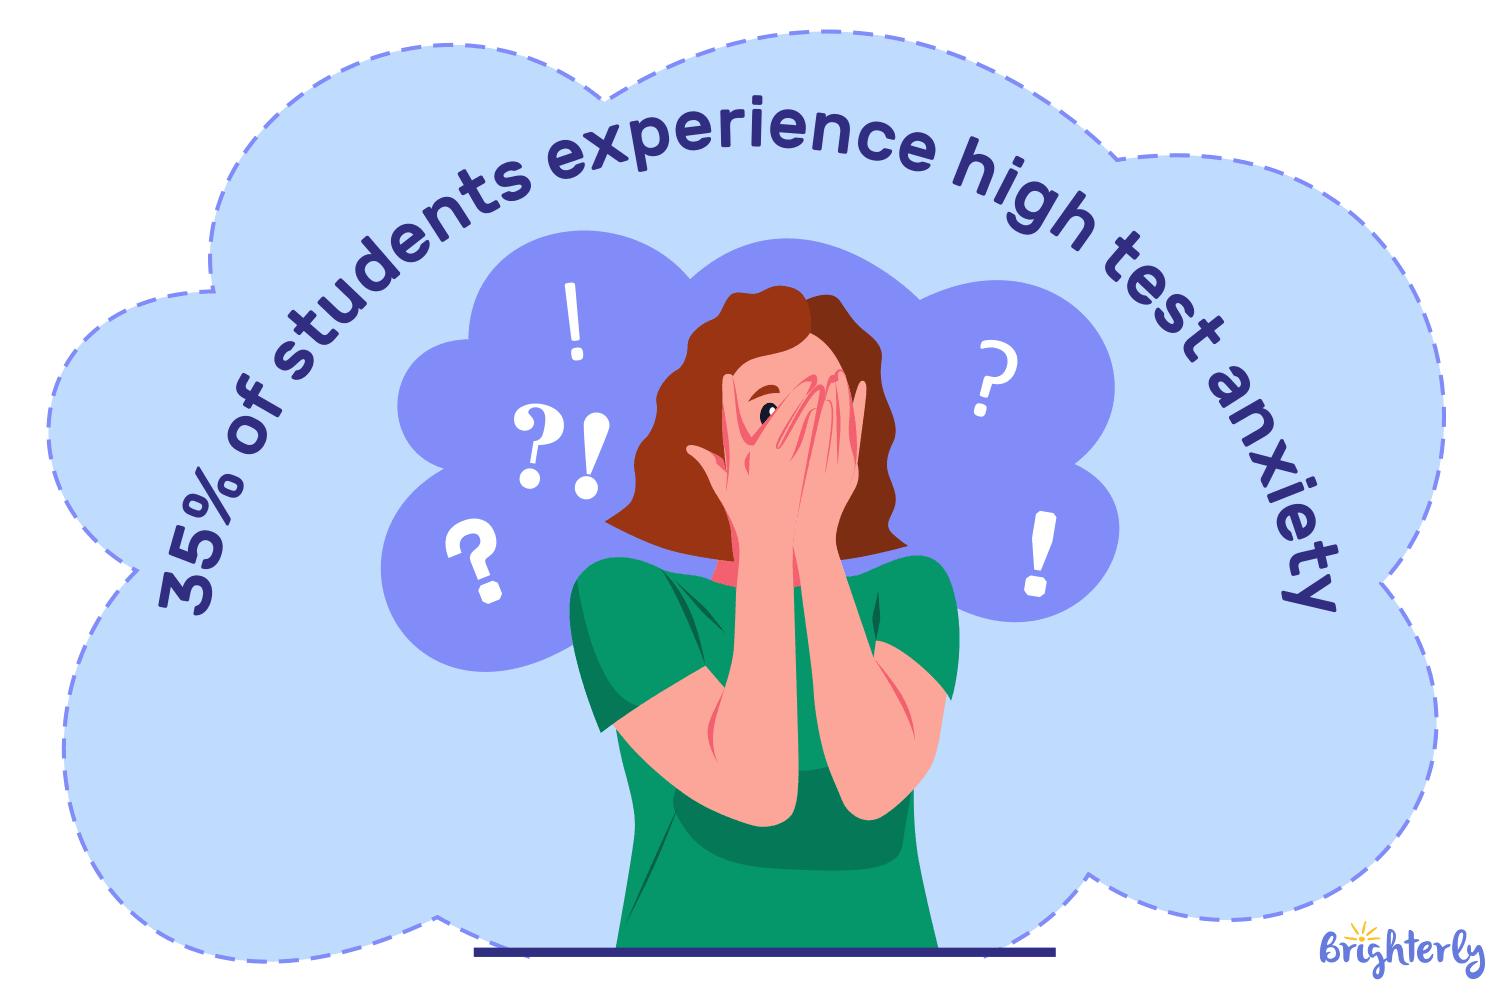
Standardized testing test anxiety statistics are better researched for students from universities, with almost all of 3,000 surveyed students reporting at least one symptom of test anxiety in 2024. Still, a 2016 PubMed research validates the estimation from other studies that between 10-40% of all K-12 students experience test anxiety of some level, with factors like gender, race, and income at the core.
What is a standardized test score in statistics?
A standardized test score in statistics is a number that demonstrates the students’ performance on a unified scale to evaluate and compare it with others in a defined population. To get a standardized test score, the evaluators convert the number of correct answers or points earned into a standard score value.
Standardized testing score statistics: How to deal with it?
Even though testing seems objective and clear, there are negative effects of standardized testing on students statistics:
- It still requires a board who makes a final decision and does a conversion
- It doesn’t take into account the specifics of individual learning
- High achievement in standardized testing doesn’t equal deep subject knowledge
Subjectively, testing causes severe anxiety problems for kids all over the US. As a parent and teacher, you can spot clear signs of them that require extra care and support.
“As both an educator and a mother, I learned how essential it is to pair academic skill-building with emotional and physiological support.”
When my son Naeem experienced severe test anxiety as a college freshman, my husband and I helped him build a structured Academic Success Strategy. With intentional support, students stop seeing tests as barriers and begin viewing them as opportunities to demonstrate what they know.
Notwithstanding these negative effects, by now, there is no better tool today to get a clear sense of where your child stands academically. And the great news is that focused practice with a dedicated math tutor helps to improve scores and make testing familiar and manageable.
Conclusion: Next steps on standardized testing statistics
As standardized testing statistics 2025 show, this testing method is an imperfect yet still effective tool for evaluating academic performance, including math proficiency for K-12 students. Based on the numbers, some states have made slight progress in 2024, but the nationwide math proficiency and SAT and ACT scores are still lower than before spring 2020. This tension creates extra stress on students, boosting their anxiety levels and raising the question of whether a standardized testing procedure is really helping them to learn.
Key standardized testing pros and cons are:
+ Clarity of the studying path and benchmarks for students and parents
+ Regular tracking system of nationwide academic performance for educators
– Standardized evaluation doesn’t take into account individual specifics and social disparities
– Test results show systematic differences based on race, gender, and income level
Notwithstanding its cons and negative results, standardized testing is the practice that will stay with us, and our children need our total support to deal with it — especially if you come from a family and/or from a state that doesn’t perform statistically well on SAT, ACT, NAEP, or any other standardized test.
If your child struggles with standardized testing, you can always enroll in the Brighterly reading and math program. The website contains free worksheets and helpful math guides, along with an option to book 1:1 sessions with math and reading tutors.
To get started, just book free lesson! On it, Brighterly teachers can evaluate your child’s level, identify areas for improvement, and provide all the assistance needed before the standardized math test.


