Linear Graph – Definition with Examples
reviewed by Jo-ann Caballes
Updated on October 8, 2024
Brighterly math tutors, we simplify math concepts and make them easy and fun to learn.
Here, we’ll cover linear graphs, taking you through what a linear graph is, the equation, examples of linear graphs and how to plot a linear graph, and we’ll share solved math problems to help you practice your learning.
What is a linear graph?
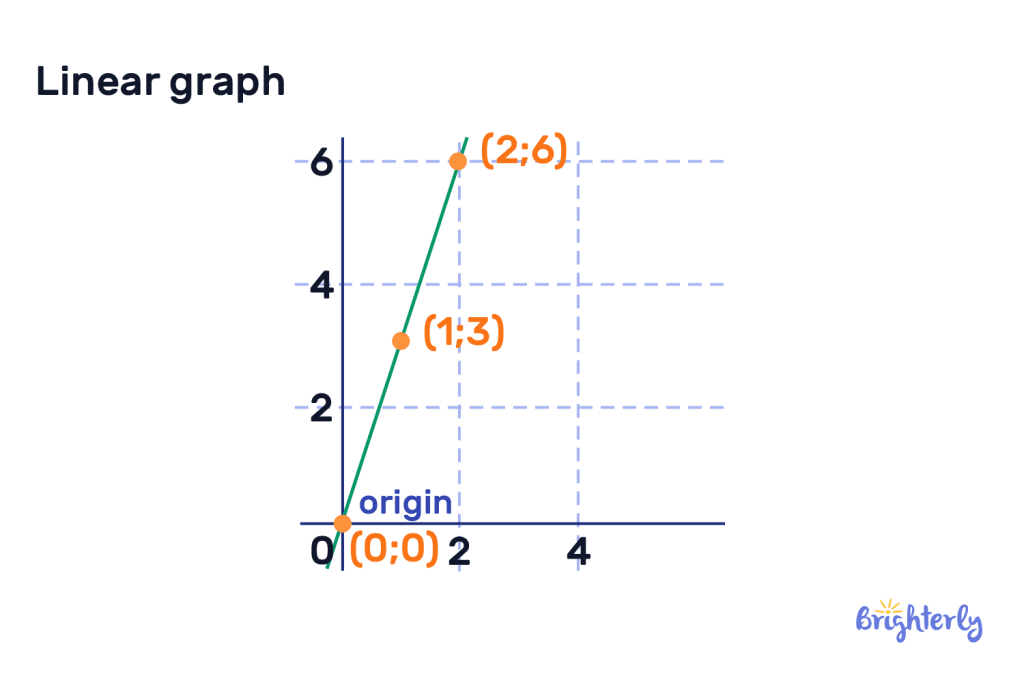
A linear graph represents a linear equation with two variables (x and y) in the form of a graph. It’s formed of a straight line on a two-dimensional graph or coordinate system. This line never bends or curves.
Here’s an example of linear graphs:

Linear graph definition
A linear graph is a straight line that connects two variables on a graph created from a linear equation. A linear graph will always be straight and never deviate from its straight slope.
The definition of linear in math comes from the word ‘line’, which is an easy way to remember that different linear graphs have straight lines.
Different linear graphs have real-world applications, including calculating your savings, representing the acceleration of a car and even predicting future populations. This means they go beyond the world of math and are key in other disciplines, including economics, physics and engineering.
Expert Math Tutors for Every Level
Connect with professional and certified educators who provide specialized support for every grade level, from elementary school basics to advanced algebra
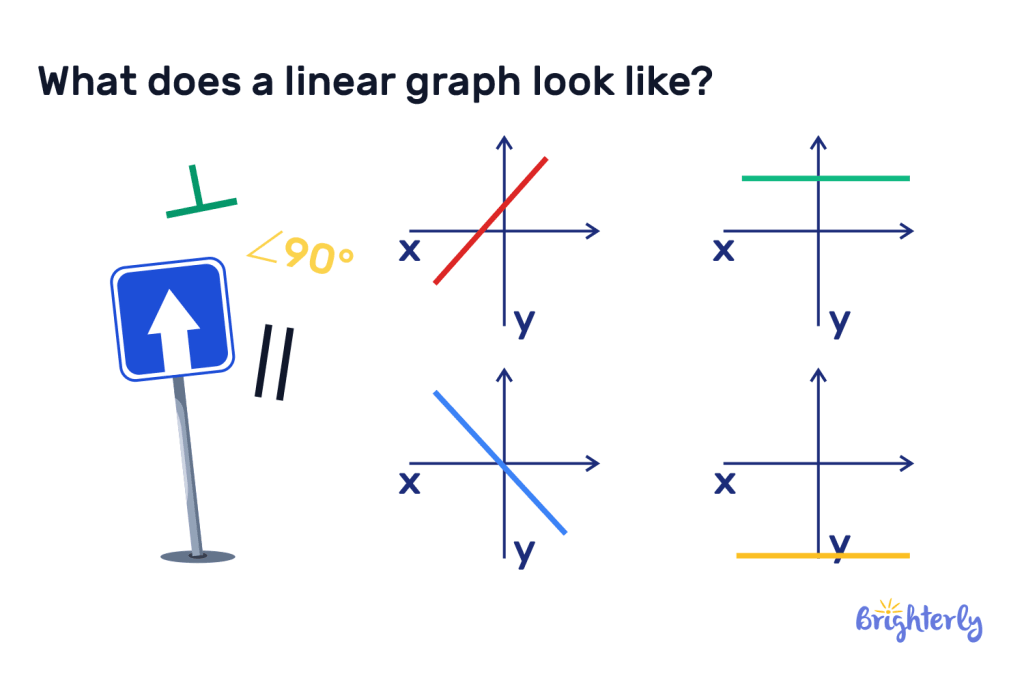
What does a linear graph look like?
A linear graph will have an x-axis (horizontal) and a y-axis (vertical). It will feature a straight, unbent line that represents the relationship between the x coordinate and the y coordinate.
What is a straight line on a graph called?
A straight line on a graph is called a linear graph.


Help your child reach their full potential!
Answer a few quick questions about your child’s learning, and we’ll recommend next steps.
Linear graph vs line graph: difference
There are differences between linear graphs and line graphs. Both use lines to represent relationships between variables, but they’re not always the same thing.
Types of graphs: linear
A linear graph will always feature a straight line on a graph that represents a linear equation. It’s straight because it represents a consistent relationship between the two variables. This means that with every unit change in the x-axis (the input), the y-axis (output) changes by a consistent amount, resulting in a straight slope.
Types of graphs: line
A line graph, however, is a broader type of graph. These graphs also represent data and often equations, that change over time, but the relationships don’t need to be linear – i.e. consistent. The lines on a line graph can be curved, bent or zig-zagged to show changing variables.

An easy way to remember the difference is to understand that different linear graphs are line graphs, but not all line graphs are linear graphs.
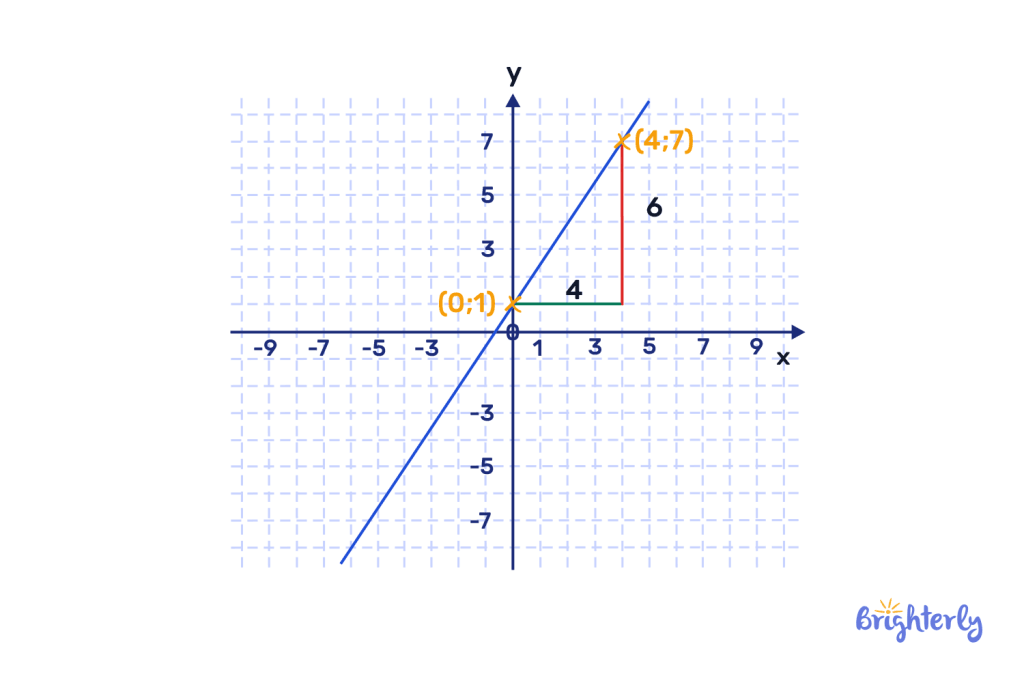
What is a linear graph equation?
The linear graph equation is: y = mx + c.
The elements represent the following:
- ‘y’ represents the output (dependent variable)
- ‘m’ represents the slope of the line and the rate at which y changes for a unit change in x
- ‘x’ represents the input (independent variable)
- ‘c’ represents the y-intercept
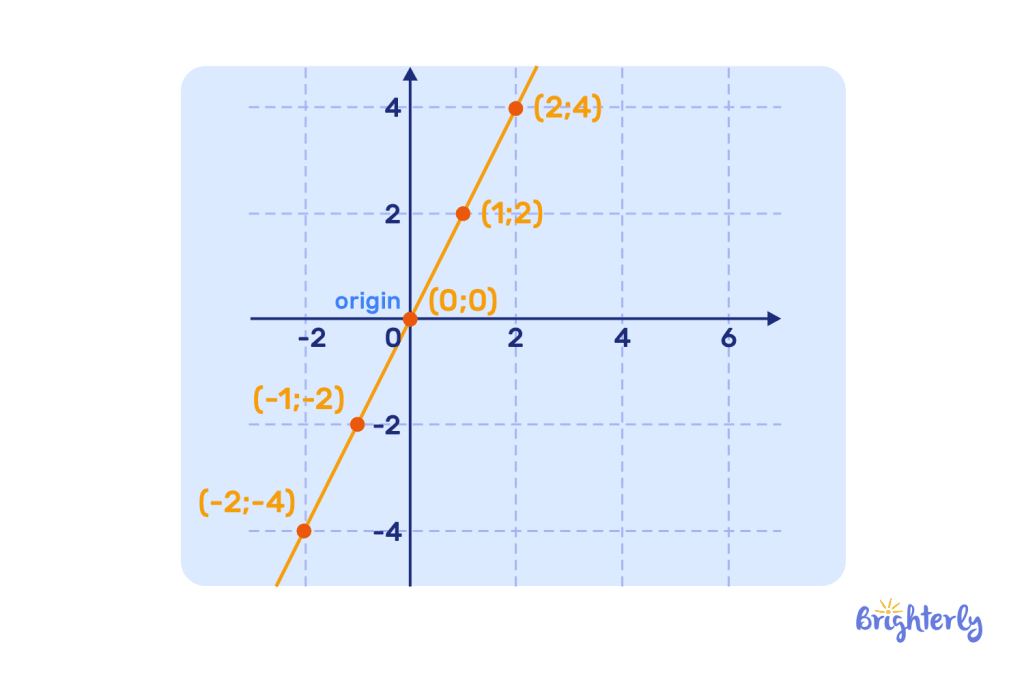
How to plot a linear graph
You can easily plot a linear equation on a graph with these simple steps:
- Use the equation y = mx + c to identify the slope (m).
- On the y-axis, mark the y-intercept (c).
- Plot your additional points by moving from the y-intercept along the slope, moving upwards if the trend is positive and downwards if it’s negative.
- Finally, connect all your points with a straight line.
Solved math tasks: examples
Solved math task 1
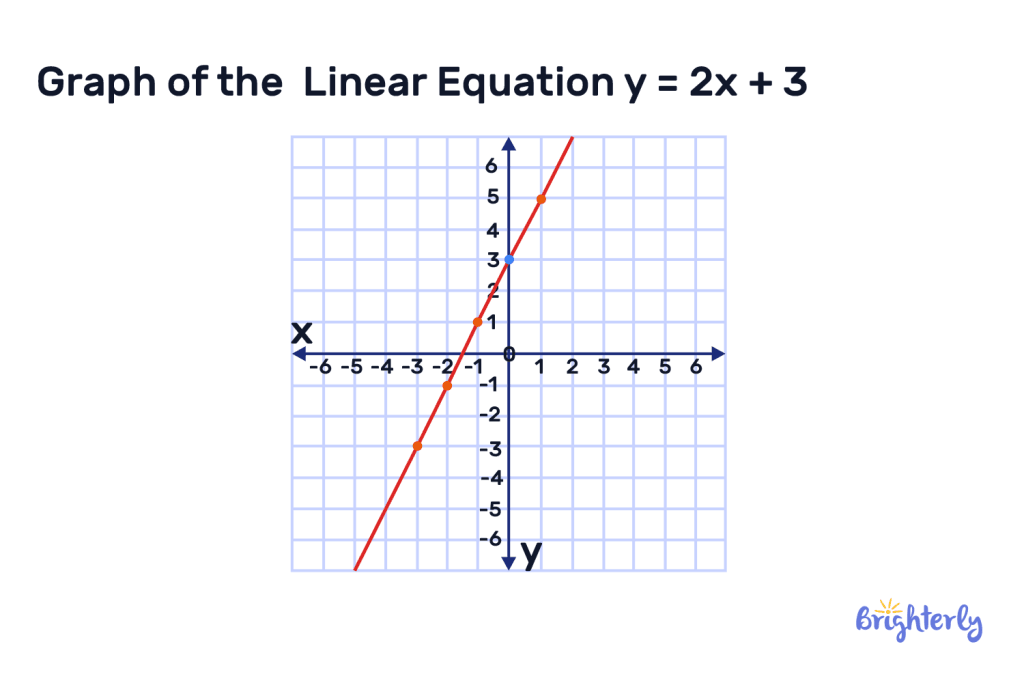
You have an equation of y = 2x + 3, where the y-intercept is 3 and the slope is 2.
Plot out this linear graph, starting from point (0,3) on the y-axis and moving two units up for every increase on the x-axis. Then, connect your points to form your linear graph.
Answer:
Solved math task 2
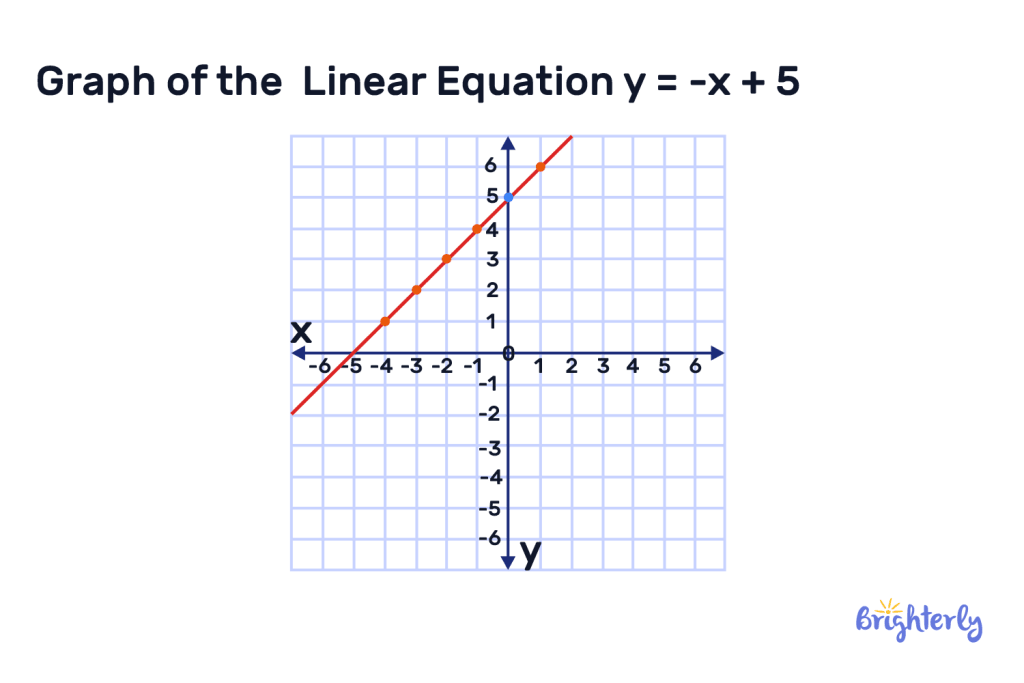
You have an equation of y = -1x + 5, where the y-intercept is 5 and the slope is -1.
Plot out this linear graph, starting from point (0,5) on the y-axis and moving one unit down for every decrease on the x-axis. Then, connect your points to form your linear graph.
Answer:
Linear graph: practice math problems
Linear graph worksheets
We’ve created a number of math worksheets on different linear graphs and key-related math concepts to help you fully understand and practice this math concept:


Math & reading from 1st to 12th grade
Looking for homework support for your child?

Choose kid's grade
Math & Reading for Grades 1–12
Build real confidence for your child with a Brighterly math or reading tutor.