The Latest US Literacy Statistics for Children and Adults (2026)
reviewed by Franz Jerby Delos Santos
Updated on September 1, 2026
Key Points:
- Official NCES 2024 literacy statistics state that only 31% of the US 4th graders and 30% of 8th graders read at or above the NAEP Proficient level, and 40% of 4th graders score below the NAEP Basic level.
- According to PIAAC, in 2023, 28% of US adults (from 16 to 65 yo) performed at or below Level 1 in literacy, and 44% performed at Level 3 or above.
- Children not reading proficiently by 3rd grade are 4 times more likely to drop out of high school; for low-income struggling readers, that risk increases to 6 times higher.
- AECF states that demographically, 80% of low-income 4th graders don’t read at grade level, and 52% of non-native-born adults score at or below Level 1 in adaptive problem solving vs. 27% of native-born adults (according to PIAAC 2023).
- Several authoritative research studies published on PubMed in 2025-2026 mention that early home reading correlates with higher literacy proficiency later (and Brighterly can help with that).
Official literacy statistics, about both children and adults, are presented here by state, in their dynamics over the years, explaining the reasons for illiteracy and how it might affect kids’ future and the US economy altogether. Spoiler? Personalized reading tutoring can help your kid further avoid unfavorable illiteracy stats.
US Literacy Rate: Key Statistics
|
Age group |
Latest official statistic (2023-2024) |
What it means |
|
4th-grade students |
31% performed at or above NAEP Proficient in reading in 2024 |
About 69% were below the NAEP Proficient level |
|
4th-grade students |
60% performed at or above NAEP Basic in 2024 |
40% performed below NAEP Basic |
|
8th-grade students |
30% performed at or above NAEP Proficient in reading in 2024 |
Approx. 70% were below NAEP Proficient |
|
12th-grade students |
35% performed at or above NAEP Proficient in reading in 2024 |
About 65% were below NAEP Proficient |
|
12th-grade students |
68% performed at or above NAEP Basic in 2024 |
32% performed below NAEP Basic |
|
US adults, 16-65 yo |
28% scored at Level 1 or below in literacy in 2023 |
Approx. 1 in 4 adults had low literacy skills (according to the PIAAC literacy proficiency and rate meaning) |
|
US adults, 16-65 yo |
44% performed at Level 3 or above in literacy in 2023 |
These adults demonstrated stronger literacy proficiency, including the ability to handle more complex texts and tasks |
|
US adults, 16-65 yo |
13% scored at Levels 4 or 5 in literacy in 2023 |
About 1 in 8 adults were high performers in literacy |


Find out how well your child reads
Brighterly lessons align with US state standards and improve reading levels accordingly.
Cost of Illiteracy to the US Economy
The latest federal data don’t provide a current dollar estimate for the economic cost of adult low literacy. However, a frequently cited 2020 Gallup study commissioned by the Barbara Bush Foundation for Family Literacy assessed that bringing all US adults to at least Level 3 literacy proficiency could generate $2.2 trillion in additional annual income.
This modeled estimate predates the most recent 2023 PIAAC results, which show that lower literacy proficiency is associated with weaker employment outcomes and lower earnings. Reduced employment opportunities and lower wages result in reduced tax revenue at federal, state, and local levels. Additionally, lower literacy levels correlate with higher utilization rates of state social services and safety-net programs.
Explore Brighterly Learning Experience
Learn exactly how Brighterly helps students thrive through expert sessions, online tools, and proven feedback from thousands of satisfied parents
Child Literacy Statistics in the United States
31% of fourth-grade students scored at or above the NAEP Proficient level, which indicates solid academic performance and competency. 60% of fourth-grade students performed at or above the NAEP Basic level (means partial mastery of foundational skills).
Note: The United States doesn’t have a clear national literacy rate for children. What does literacy rate mean? Literacy is tracked by proficiency levels, not just basic reading ability. However, the most reliable and complete data comes from the National Assessment of Educational Progress (NAEP), often called ‘The Nation’s Report Card.’
Recent data from NAEP shows troubling trends (despite decades of educational initiatives and considering a significant pandemic learning loss caused by COVID-19):
- Proficiency rates are dropping. Only 31% of fourth-graders and 30% of eighth-grade students performed at or above the NAEP Proficient level.
- Increased below-Basic levels: 40% of fourth- and 33% of eighth-graders scored below the NAEP Basic level.
- Reading performance differs a lot from state to state.
- Racial and socioeconomic disparities. 60% of Black eighth-graders and 54% of Hispanic ones scored below the Basic level.
The good news is that sites like Brighterly can help your child avoid illiteracy statistics. In particular, we provide early reading tutoring and middle school reading help for kids to develop literacy skills timely.
Children who engage in regular reading and storytelling with family members, too, tend to perform better in reading assessments. Start with reading challenges for kids or reading worksheets for kids that we particularly developed for children from 1st to 12th grade. You’ll find a whole diversity of activity types – all collected based on the kids’ grades.
Give your child a strong literacy foundation
Brighterly combines engaging lessons with personalized guidance to build confident young readers.
Child Literacy Rates by State
In 2024, only 31% of fourth-grade students nationwide scored at or above the NAEP Proficient level in reading. That’s a 2-point drop from 2022 and 4 points lower than 2019. Even more concerning, 40% of fourth-graders scored below the NAEP Basic level in 2024. Unfortunately, it’s the highest percentage since NAEP started tracking child literacy statistics in 1992.
Here’s a brief summary of the U.S. literacy rate by state:
|
Top-Performing States |
||
|
State |
Literacy statistics on 4th-grade reading proficiency (NAEP 2024) |
More context |
|
Massachusetts |
~40-48% |
Repeatedly has a comparatively high percentage of students performing at or above the NAEP Proficient level in the 2024 assessment |
|
Maryland |
High range (35-40%) |
One of the top 3 states for childhood literacy statistics |
|
New Hampshire |
High range (35-40%) |
Has the third-highest child literacy rate; it also has the highest adult literacy rate at 94.2% |
|
Florida |
33% |
Leads all Southern states in 4th grade reading proficiency |
|
Lowest-Performing States |
||
|
State |
Statistics about literacy |
|
|
New Mexico |
According to the National Literacy Institute, it’s the lowest child literacy rate in the country + most shocking illiteracy statistics |
|
|
Louisiana |
One of the bottom three states, the adult literacy rate is 84% |
|
|
Mississippi |
Ranks in the bottom 3 for child literacy; 84% adult literacy rate |
|
Regardless of the state you’re living in, you may enroll in our personalized reading program, which is available for attendance online and one-on-one with a professional tutor. Our lessons align with US state standards and adjust to every kid’s current level and future academic goals. Our pricing options start from $17.70/lesson (2 lessons/week, 12-month plan, now 20% off).
U.S. Child Literacy Rate by Year (2019-2025)
2019 – 2020: Child literacy statistics United States
|
Fourth-grade reading performance (2019) |
In 2019, NAEP revealed concerning trends in child literacy rates across the United States:
|
|
Eighth-grade reading performance (2019) |
Other findings of the Nation’s Report Card claim the following:
|
2021 – 2023: Average young American reading level
The October 2022 release of NAEP scores for fourth and eighth-graders showed major learning setbacks across all grade levels:
|
Fourth-grade reading (2022) |
|
|
Eighth-grade reading (2022) |
|
|
The pandemic’s severe impact: 2021-2022 The 2021-2022 literacy rates US showed the true extent of learning loss from the pandemic in child literacy across America. In September 2022, the NAEP released long-term trend data for 9-year-olds that shocked education experts nationwide. |
|
|
Reading results (9-year-olds) |
|
|
Mathematics results (9-year-olds) |
|
According to Peggy Carr, Commissioner of the National Center for Education Statistics, ‘These are some of the largest declines we have observed in a single assessment cycle in 50 years of the NAEP program. Students in 2022 are performing as they did two decades ago.’
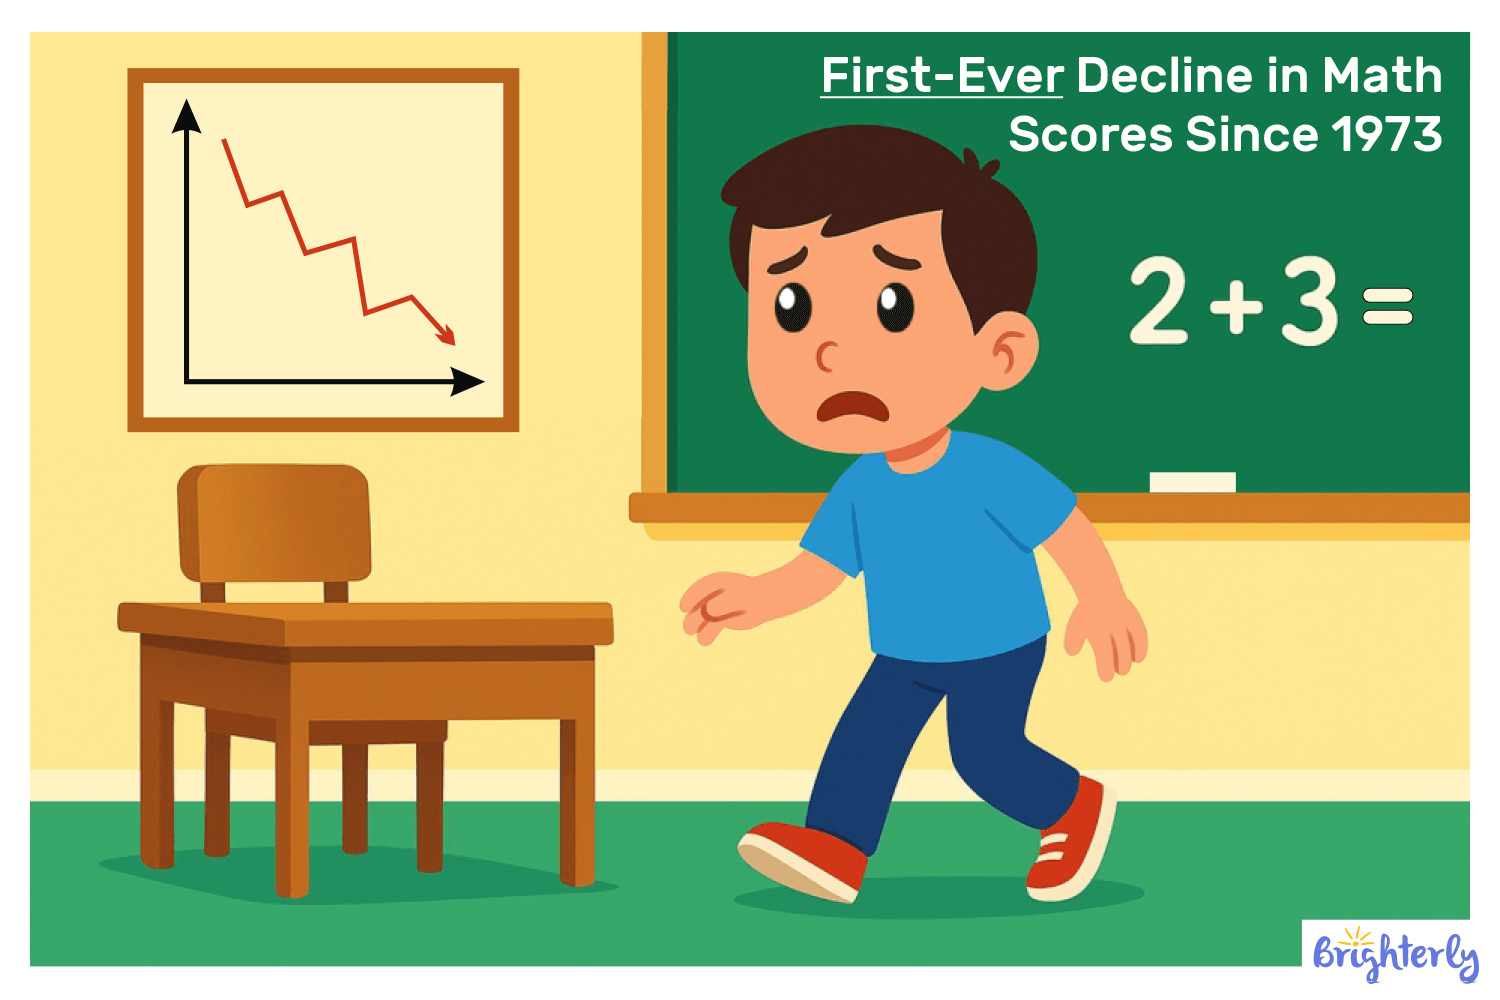
Note: Standardized testing statistics show ongoing struggles in high school proficiency, along with significant shifts in overall student performance. At the same time, testing formats continue to evolve, and universities are requiring test scores again.
2024 – 2025: What percentage of young Americans are illiterate?
As of 2024-2025, the United States is dealing with a continuing literacy crisis among kids. It’s gotten even worse since the COVID-19 pandemic. The latest National Literacy Institute data shows that approximately 64% of fourth-grade students nationwide are not reading proficiently.
Fourth-grade reading performance (NAEP, 2024)
|
2024 result |
Change vs. 2022 |
Change vs. 2019 |
Historical context |
|
|
Average literacy rate (0-500 scale) |
215 |
⬇️ 2 points (from 217) |
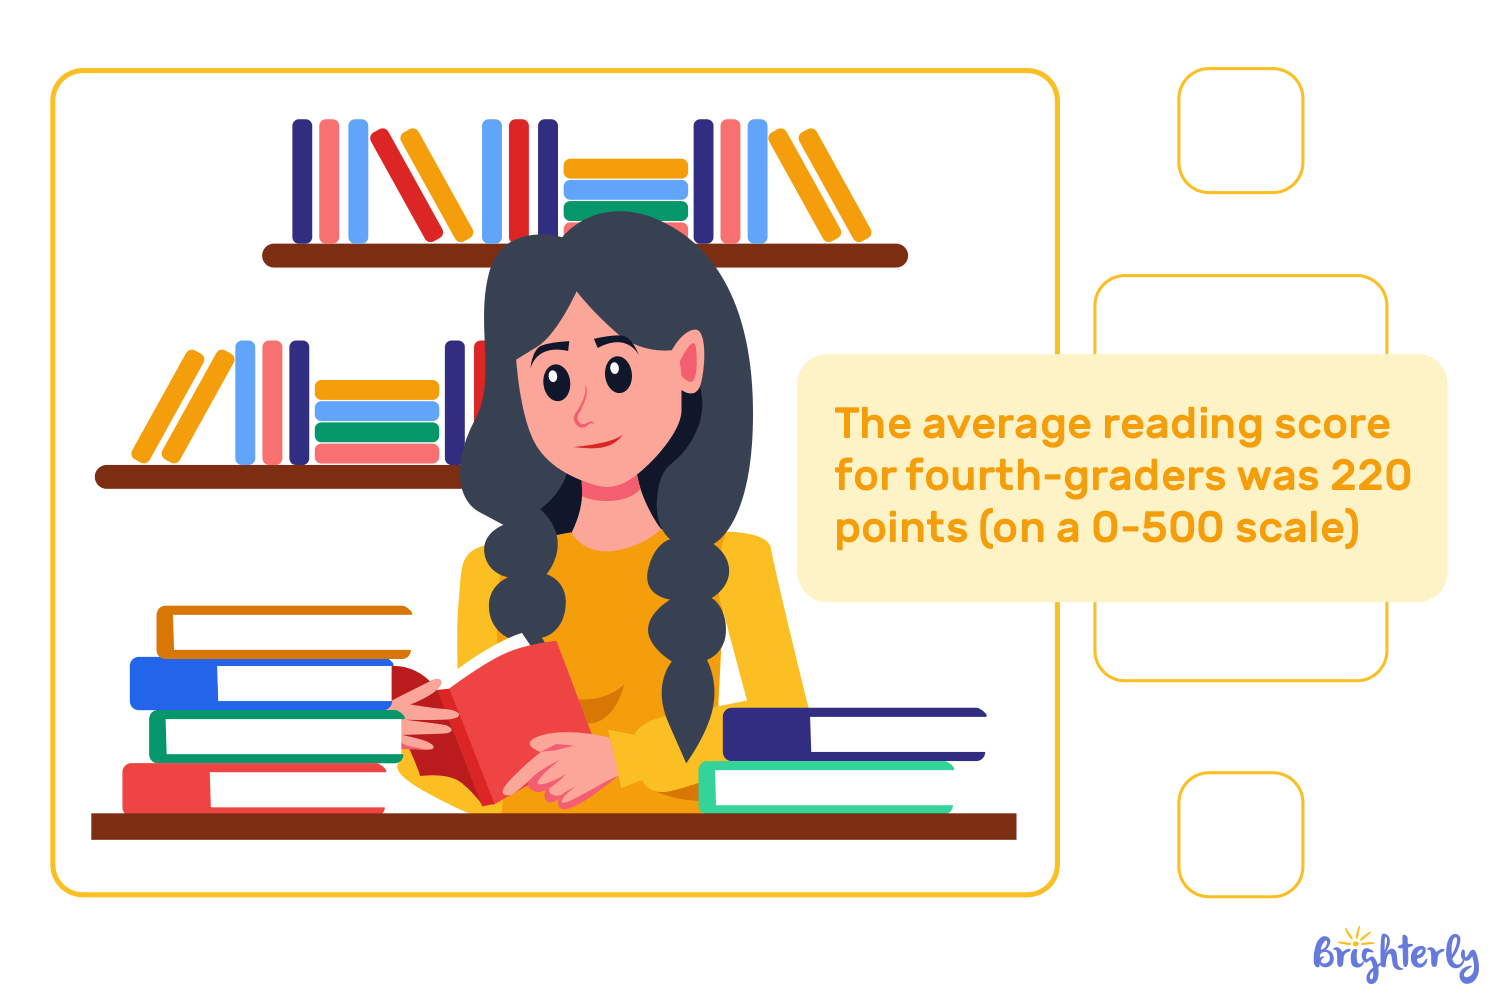
⬇️ 5 points (from 220) |
Equal to the 1992 level – three decades of progress erased |
|
% at or above NAEP Proficient |
31% |
⬇️ 2 pp (from 33%) |
⬇️ 4 pp (from 35%) |
⬇️ 6 pp from 2017 peak (37%) |
|
% below NAEP Proficient |
69% |
— |
— |
— |
|
% below NAEP Basic |
≈ 40% |
— |
— |
Highest since 2002 |
|
Effects of illiteracy |
Many students scoring < Basic can’t identify a reason for a character’s action implied in a story. |
|||
Eighth-grade reading performance (NAEP, 2024)
|
2024 result |
Change vs. 2022 |
Change vs. 2019 |
Historical context |
|
|
Average literacy rate (0-500 scale) |
258 |
⬇️ 2 points (from 260) |
⬇️ 5 points (from 263) |
— |
|
% at or above NAEP Proficient |
30% |
— |
— |
Lowest since 1994 |
|
% below NAEP Proficient |
70% |
— |
— |
— |
|
% below NAEP Basic |
≈ 33% |
— |
— |
Highest ever recorded |
|
Effects of illiteracy |
Students below Basic often lack the knowledge and skills to interpret an author’s argument or understand complex text structures. |
|||
Nearly five years after the COVID-19 pandemic began, the country is still behind its 2019 (pre-pandemic) scores in both grades and subjects. As per the Nation’s Report Card, just two states have beaten their pre-pandemic scores in any single grade or subject: Louisiana in fourth-grade reading and Alabama in fourth-grade math.
Kids’ Illiteracy Rate in America: Statistics & Facts
About 25 million kids in the U.S. can’t read at grade level, according to NAEP test results. Plus, NAEP data shows that 67% of 4th graders and 69% of 8th graders across the country aren’t reading at grade level. Some more interesting stats:
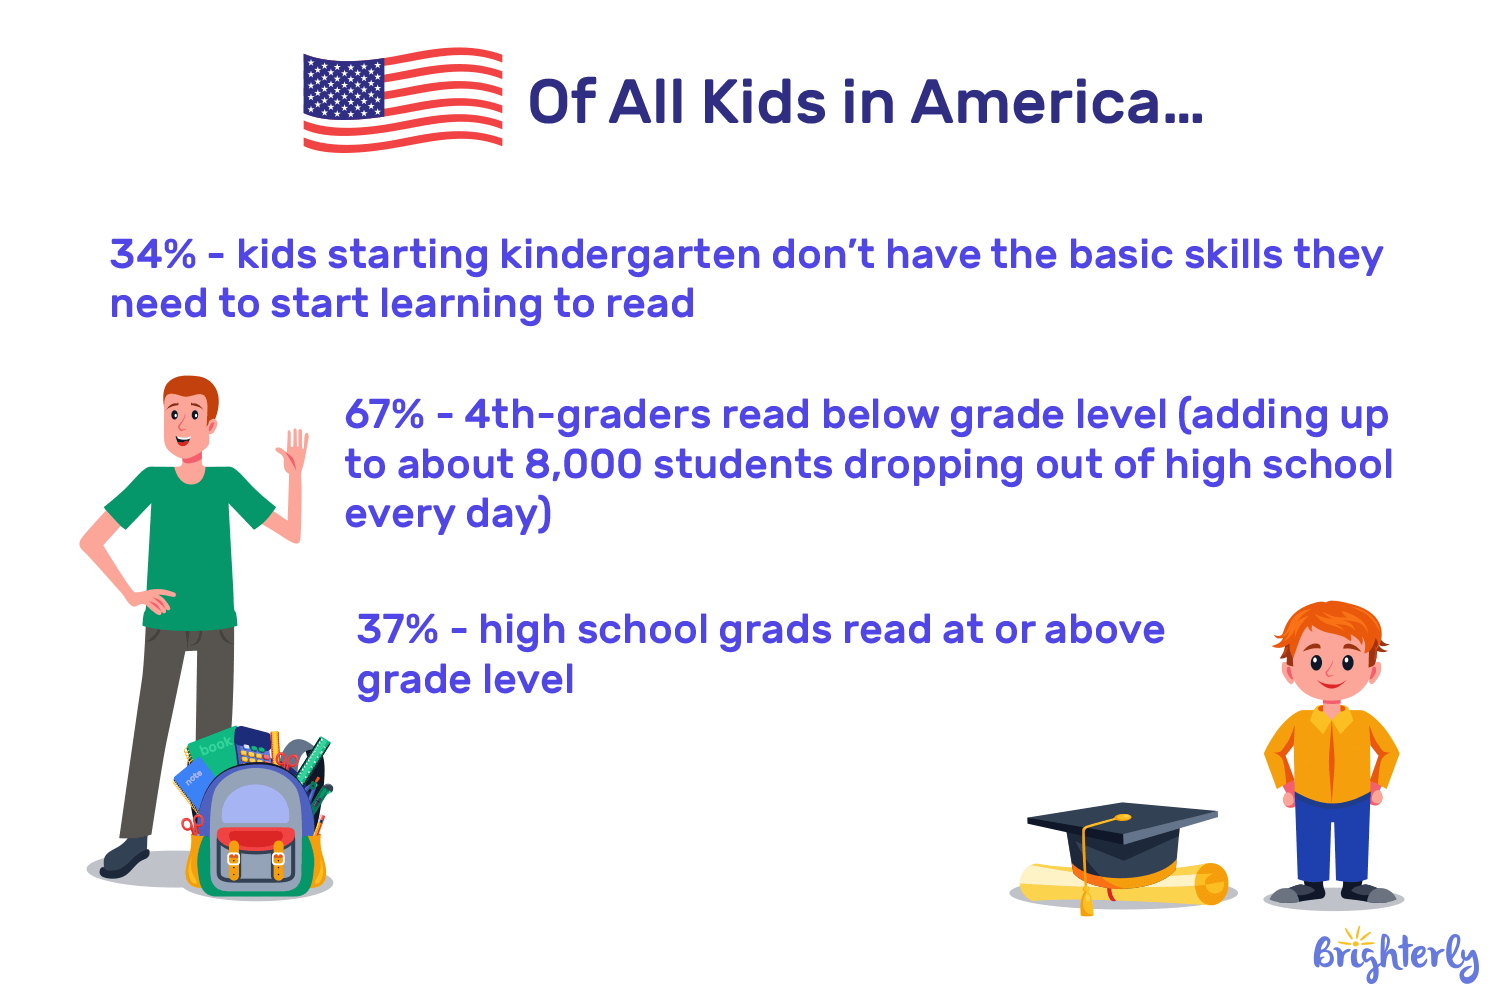
- Two out of 10 kids start kindergarten with skills two to three years below grade level. Kids who start behind usually only make about a year’s progress each grade.
- About 25% of kids in the U.S. grow up not being able to read.
- A child encountering difficulties at the end of 1st grade has about a 90% chance of still struggling by 4th grade. That’s why early help makes such a big difference once kids start to fall behind.
- Kids who aren’t reading at grade level by 3rd grade are four times more likely to drop out of high school than strong readers.
- Kids who start kindergarten behind have less than a 12% chance of ever going to college – that’s how early reading gaps turn into lifelong struggles.
- Around 85% of teens in the justice system can’t read well enough to get by. And about 70% of people in U.S. prisons can’t read above a 4th-grade level.
- 80% of low-income kids aren’t reading at grade level by 4th grade, compared to kids from higher-income families. More specifically, only 20% of 4th graders from low-income families read at grade level, which is way lower than the 51% of 4th graders from higher-income families who read at grade level.
- Kids whose parents struggle with reading are 72% more likely to read below grade level in school, keeping the cycle of low literacy going from one generation to the next.
Early Literacy and the Home Environment
The National Household Education Surveys Program (NHES) gave a look at some early childhood literacy statistics on reading activities at home for young children (ages 3-5 not yet in kindergarten):
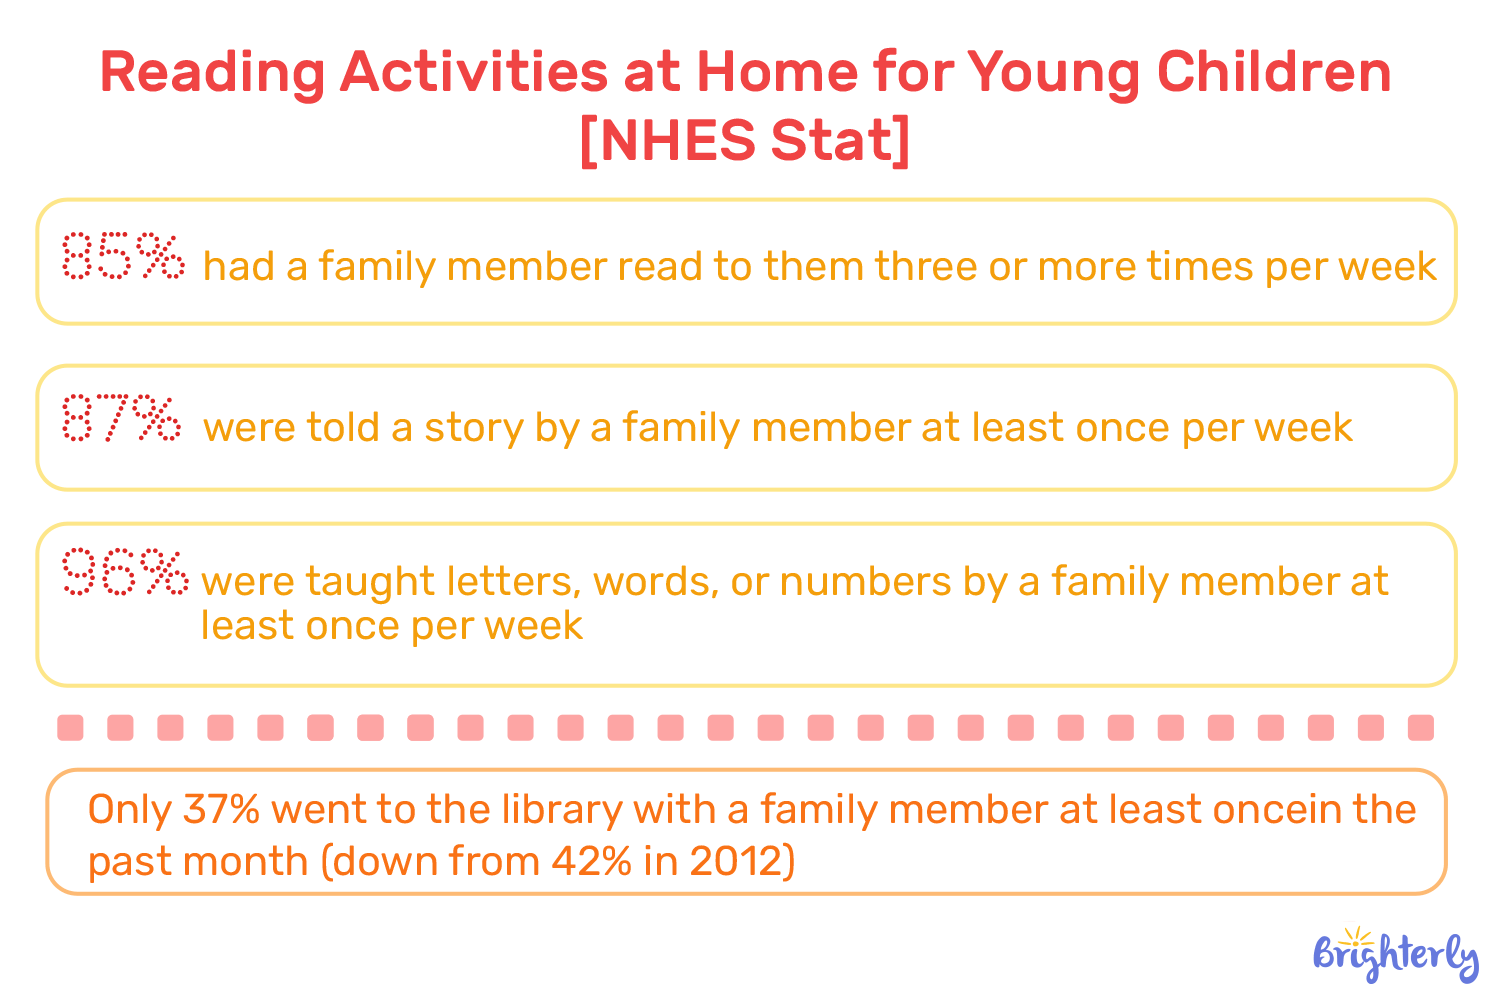
There were clear racial gaps in home reading activities, too. 91% of White children and 89% of multiracial children had someone read to them three or more times a week. That’s in contrast to 81% of Asian children, 77% of Hispanic children, and 75% of Black children.
US Adult Literacy Rate: Key Numbers
According to the latest PIAAC results from NCES, 28% of US adults aged from 16 to 65 performed at Level 1 or below in literacy in 2023, compared with 19% in 2017. At the other end of the scale, 44% performed at Level 3 or above, and the remaining 28% performed at Level 2.
American Literacy Rate by State (Adult)
|
State |
Adults at or below PIAAC Literacy Level 1 (which assesses adults’ ability to understand and use written information in real-life contexts) |
|
New Mexico |
29% |
|
California, Texas, Mississippi |
28% |
|
Louisiana |
27% |
|
Nevada |
25% |
|
New York, Alabama, Florida, Georgia |
24% |
|
Arizona, Arkansas |
23% |
|
South Carolina, District of Columbia, Kentucky, Tennessee |
22% |
|
North Carolina, West Virginia, New Jersey |
21% |
|
Rhode Island, Illinois, Delaware, Oklahoma, Maryland |
20% |
|
Missouri, Virginia, Indiana |
19% |
|
Pennsylvania, Ohio, Michigan |
18% |
|
Massachusetts, Connecticut, Kansas, Oregon, Colorado |
17% |
|
Nebraska, Idaho, Washington, Hawaii |
16% |
|
Wisconsin, Iowa, South Dakota |
15% |
|
Utah, Wyoming |
14% |
|
Maine, North Dakota, Montana, Minnesota, Vermont, Alaska |
13% |
|
New Hampshire |
11% |
Immigration and Literacy
34% of US adults with low literacy weren’t born in the US, with many immigrants, legal or not, being 60% more likely to have adult illiteracy above 20% for the adult population.
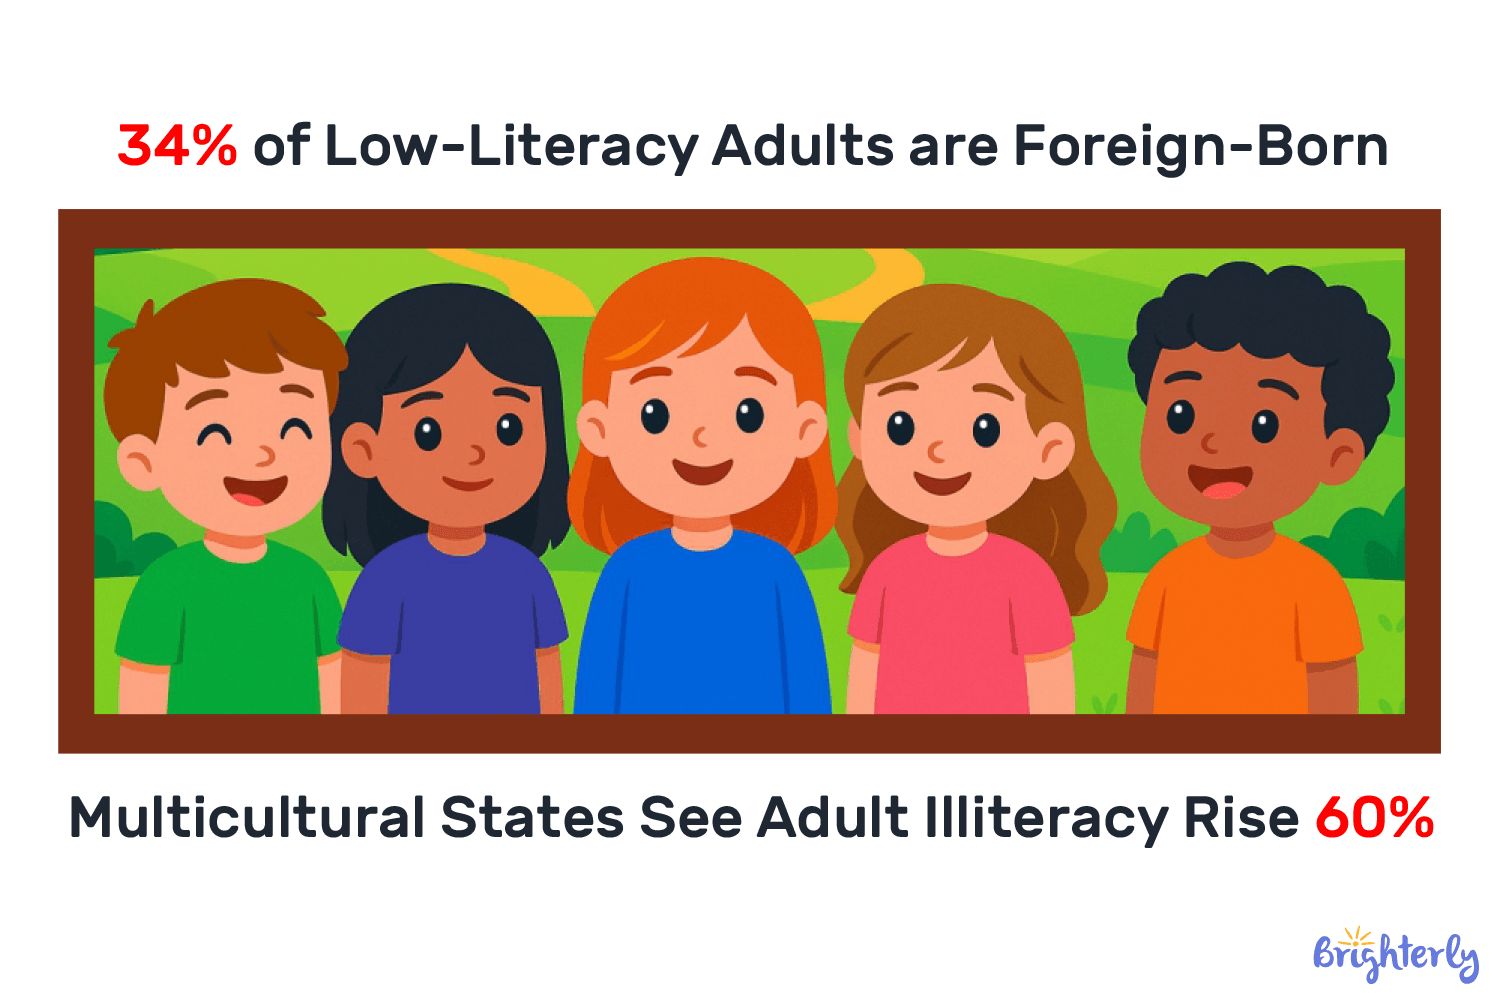
According to the 2023 PIAAC data, 18% of US adults between 16 and 65 years old were born outside the United States, and it’s up from 14% in 2017. Adults born outside the US had lower average literacy proficiency than US-born adults, although the difference varied depending on various factors (English-language background, years in the US, etc.) In adaptive problem solving, for instance, 52% of non-native-born adults scored at Level 1 or below, compared to 27% of native-born adults.
Note: Level 1 literacy means an adult can read and understand short, simple texts and pick out one clear piece of information. They can handle basic tasks like reading a short notice or simple instructions. However, they struggle with longer texts, complicated directions, or reading between the lines.
Gender and Age Differences
In 2023, according to PIAAC illiteracy rates in America, there were no major gender differences. Both males and females had more adults at the lowest proficiency level:
- Male: 29% at Level 1 or below (increased from 19% in 2017)
- Female: 26% at Level 1 or below (increased from 18% in 2017)
Adults 55-65 did worse than everyone else in both literacy and adaptive problem solving in 2023. The percentages of US adults performing at Level 1 or below in literacy increased across all age groups between 2017 and 2023, except those aged 45-54.
Comparison Between Child and Adult Literacy Rates
|
Group |
Assessment / year |
Average score |
Change from the previous |
Historical comparison |
% below Basic / Level 1 |
Facts about literacy |
|
|
Overall literacy |
Kids (4-8 grade) |
NAEP 2022 |
217 (4th), 260 (8th) |
⬇️3 points (vs 2019) |
Lowest since early 2000s; same as 1992 |
37% (4th), 30% (8th) |
Two-thirds of US students are not reading proficiently |
|
Adults (ages 16-65) |
PIAAC 2023 |
⬇️12 points (vs 2017) |
Largest decline since 2012 |
28% at Level 1 or below |
Over half of adults read below a 6th-grade level |
||
|
Proficiency rates |
4 grade |
NAEP 2022 |
— |
— |
— |
67% not proficient |
Reading proficiency is at its lowest since 2005 |
|
8 grade |
NAEP 2022 |
— |
— |
— |
69% not proficient |
30 years of progress erased |
|
|
Lowest proficiency trend |
Both groups |
— |
— |
— |
Persistent since the 1990s |
25-33% below basic / Level 1 |
Indicates inability to perform age-appropriate reading tasks |
|
Cross-generational impact |
Kids & adults |
— |
— |
— |
— |
— |
About two-thirds of both age groups struggle with literacy |
Key Facts About Child Literacy Rate in the US
1. Current national reading proficiency rates. Only 33% of fourth-grade students nationwide performed at or above the NAEP Proficient level in reading in 2022. That entails that 67% of fourth-graders are not reading proficiently. This shows a decline from 2019, when 34% scored at or above Proficient, and brings reading scores back to early-1990s levels, basically wiping out 30 years of progress. For eighth-graders, the picture isn’t much better! Only 31% scored at or above NAEP Proficient in 2022, down from 34% in 2019.
2. The third-grade reading benchmark: A critical turning point. Children who are not reading proficiently by third grade are four times more likely to drop out of high school than proficient readers. The rates are even more alarming for the lowest-performing readers! 23% of children who score at well below grade level in third grade drop out or don’t graduate on time, vs. just 4% of proficient readers. Yes, these below-basic readers make up only about a third of students, but they make up about 60% of kids who don’t graduate, according to child illiteracy statistics.
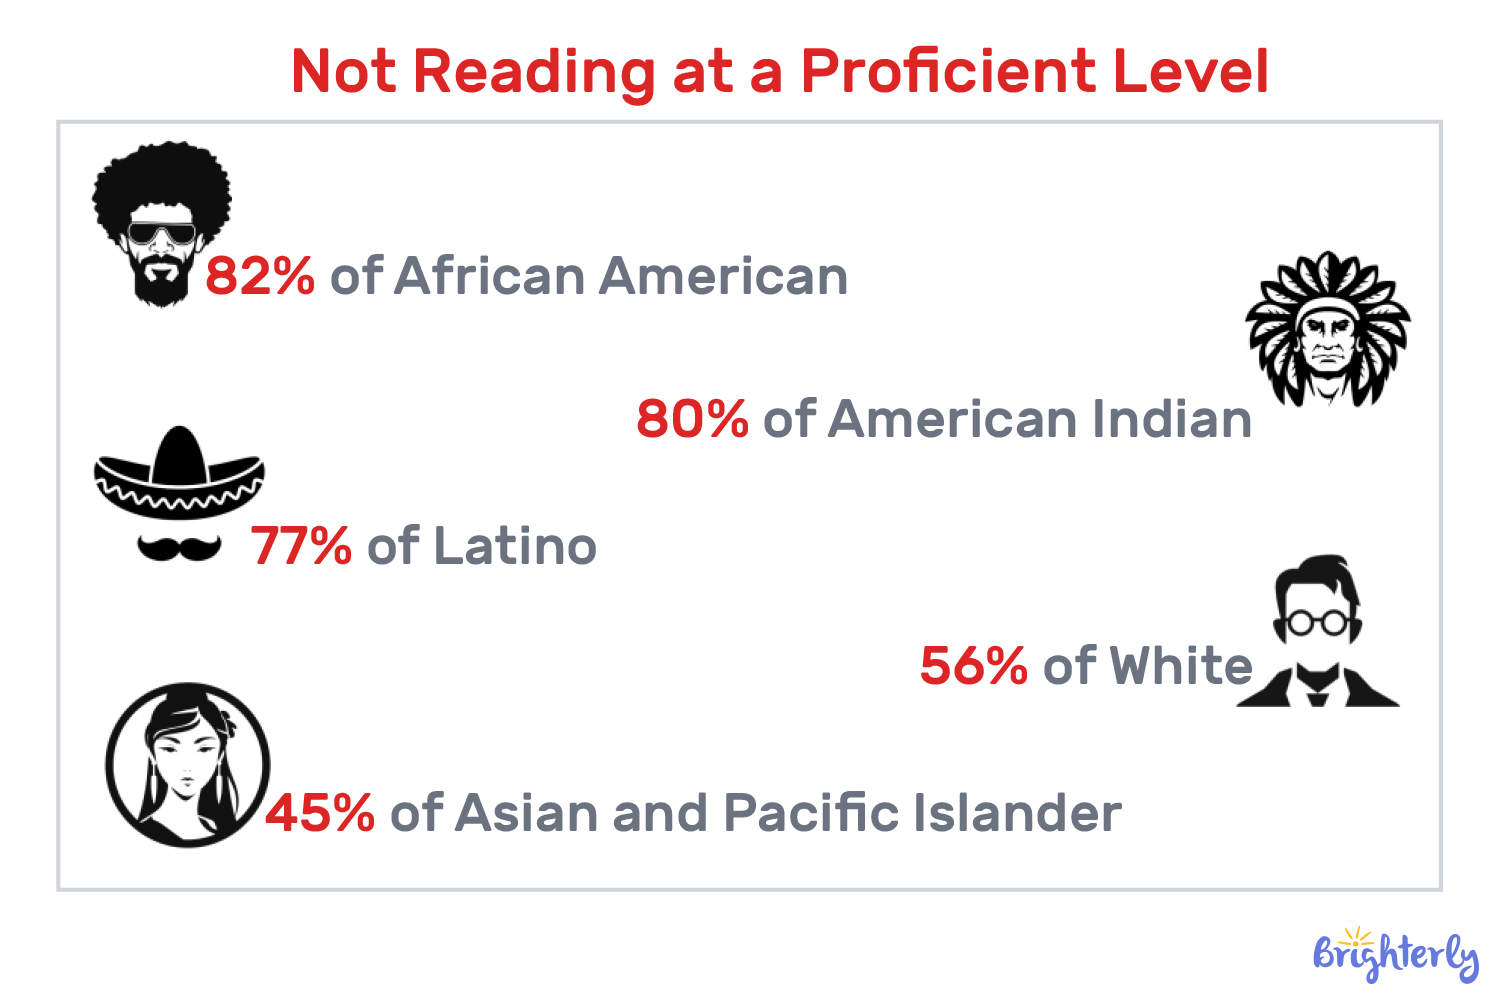
3. Racial disparities in reading achievement. According to 2019 NAEP data, the achievement gap still exists across racial and ethnic groups. Here are the shares of those who weren’t reading at a proficient level. Black and Hispanic children who are not reading proficiently in third grade are twice as likely as similar white children not to graduate from high school (approximately 25% versus 13%). When you factor in poverty, Black and Latino students who read poorly are eight times more likely not to graduate than all proficient readers.
4. The poverty factor: Double jeopardy for struggling readers. Students who live in poverty are three times more likely to drop out or fail to graduate on time than their better-off peers. When combined with poor reading skills, the dropout rate becomes six times greater than that for all proficient readers. Nationally, about 80 percent of low-income children are not reading on grade level by fourth grade, according to NAEP results. Perhaps most striking, though, proficient third-graders who have lived in poverty graduate high school at about the same rate as struggling readers who have never been poor. That’s how much poverty affects kids’ education, even for skilled readers.
So, How Many Americans Are Illiterate?
As you can see, only about one-third of students are reading proficiently, and performance is still lagging behind pre-pandemic levels. Given that literacy opens doors to lifelong learning, confidence, and academic success, early reading support is indispensable.
If your child struggles with reading at grade level, our literacy program for kids features personalized one-on-one reading lessons to help kids build comprehension, fluency, and confidence step by step. And if you’re unsure about your kid’s current reading level altogether, book free demo lesson and find out!
Frequently Asked Questions
What Is the Literacy Rate in the United States?
Among kids (NAEP, 2024):
- 31% of 4th graders perform at or above the NAEP Proficient level, and 40% – below the NAEP Basic level.
- 30% of 8th graders perform at or above the NAEP Proficient level, and 33% – below the NAEP Basic level.
- 35% of 12th graders perform at or above the NAEP Proficient level, and 32% – below the NAEP Basic level.
Nationwide, about two-thirds of 4th and 8th graders perform below grade-level expectations.
Among adults (PIAAC, 2023), 28% of US adults have low literacy, 28% have intermediate literacy, 44% have strong proficiency, and 13% reach the highest Levels 4 or 5.
What Does “Functionally Illiterate” Mean?
Being functionally illiterate describes individuals who possess basic, foundational reading skills but lack the higher-level proficiency to handle complex, real-world tasks (see types of reading skills).
Adults at Level 1 or below, for instance, struggle with multi-step directions and interpreting deeper meaning that impacts daily life, contributing to lower average weekly earnings and higher reliance on government assistance programs.
Children scoring below NAEP Basic Level lack the reading comprehension necessary for grade-level academic work. Kids not reading proficiently by 3rd grade are 4 times more likely to drop out of high school than proficient readers.
Which US State Has the Highest and Lowest Literacy Rate?
States with the highest literacy rates:
- Adults: New Hampshire – 94.2%, and it has the lowest percentage of adults scoring at or below Level 1.
- Children: Massachusetts – approximately 40-48% of students score at or above the NAEP Proficient level. Maryland and New Hampshire also rank in the top-3.
States with the lowest literacy rates:
- Adults: New Mexico has the highest percentage of adults (29%) with low literacy skills. California, Texas, and Mississippi follow closely with 28%.
- Children: New Mexico is recorded as having the lowest child literacy rate in the US. Louisiana and Mississippi also rank in the bottom-3.
Is the Literacy Rate in the USA Improving or Declining?
US education trends state that the literacy rate in the USA is declining.
Among kids, the percentage of 4th graders reading at or above the NAEP Proficient level fell from a peak of 37% in 2017 to just 31% in 2024. For 8th graders, the 2024 proficiency rate of 30% is the lowest since 1994.
Among adults, in 2023, 28% of US adults performed at Level 1 or below in literacy – a major increase from 19% in 2017. The average adult literacy score fell by 12 points between 2017 and 2023, which is the largest decline since 2012.
How Is the US Literacy Rate Measured?
For children, the National Center for Education Statistics (NCES) conducts the National Assessment of Educational Progress (NAEP), measuring student reading comprehension among 4th, 8th, and 12th graders:
- Below Basic – indicates a lack of foundational skills.
- NAEP Basic – partial mastery of prerequisite knowledge and skills.
- NAEP Proficient – strong academic performance and competency on grade-level material.
For adults (16-65 yo), NCES conducts the Program for the International Assessment of Adult Competencies (PIAAC), measuring the ability to process, understand, and use written information in real-life contexts:
- Level 1 or Below – low literacy;
- Level 2 – intermediate literacy;
- Level 3 or Above – strong proficiency.
How Many Kids Are Illiterate in the US?
There’s no single figure for complete illiteracy, but the official stats highlight severe reading deficits among American children:
- Approximately 25 million kids in the US cannot read at grade level, based on national test results.
- From 67% to 69% of 4th graders nationwide do not read at grade level.
- From 69% to 70% of 8th graders are not reading at grade level.
- About 25% of children in the US grow up unable to read, and about 2 out of 10 kids start kindergarten with reading skills 2-3 years below their expected grade level.


Kids are natural scientists – they spot, question, and wonder about everything around them. These 130 fun science facts for kids deliver real “wow” moments across animals, space, the human body, and beyond. Read one fact, and your child will want to share it with everyone at the dinner table. What Are Science Facts for […]

Oct 31, 2025

Don’t mistake reading challenges — they aren’t about making reading difficult. In fact, they are the opposite! Reading challenges for kids are all about making the reading fun and even more motivated to think and reflect on literary pieces. In this article, I will take a closer look at what reading challenges are and how […]

Nov 05, 2025
Math & reading from 1st to 12th grade
Looking for homework support for your child?

Choose kid's grade

Math & Reading for Grades 1–12
Build real confidence for your child with a Brighterly math or reading tutor.