America’s Math SOS: 8th-Grade Math Scores Decline in Every State as Searches for Math Help Hit a 5-Year High
reviewed by Jessica Kaminski
Updated on November 20, 2026
A Brighterly analysis of five years of Google search data and the Nation’s Report Card finds the struggle peaks in middle school, and families are looking for help, not just answers.
Key points:
US math scores sit below pre-pandemic levels, and families are turning to Google for help. This Brighterly report combines five years of Google search data with 2019 and 2024 NAEP results to show which grades and states fell the farthest, where families search for help, and what parents can do early on.
Are US Students Struggling With Math in 2026, and Are Families Looking for Help?
Yes. In 2024, 41% of US public school 8th graders scored below NAEP Basic, up from 32% in 2019, and Google searches for “math help” hit a five-year high in fall 2026. US math scores are lower than before the pandemic, especially in 8th grade.
NAEP Basic is the lowest of three achievement levels set by the National Assessment Governing Board (NAGB). The shares below Basic were 24% in 4th grade (up from 20%) and 45% in 12th grade (up from 40%). US Google interest in “math help” rose 63% from fall 2022 to fall 2026, peaking the week of September 20, 2026.
Methodology
Brighterly combined two public sources, pulled on November 8, 2026.
Google Trends. Weekly US web search interest, November 2021 to November 2026, for math help, tutoring, AI tools, and 31 math topics. Trends reports relative interest on a 0-100 scale, not search counts. “Fall” is the average of September and October weekly values. A second independent pull of “math help” gave +61% against the reported +63%. City figures cover the 54 largest Nielsen media markets. 9th-12th grade figures average two pulls because volume is low.
NAEP. Public school math results for grades 4 and 8, 2019 and 2024, from the NAEP Data Service API: achievement levels, average scores, and the five math areas. Changes are point estimates (2024 minus 2019), so small state changes may not be statistically significant.
State groups. The need score combines each state’s share of 4th and 8th graders below Basic with score declines since 2019. The search score averages five-year interest in “math help”, “math tutor” and “ChatGPT math”. States are split at each score’s median.
Limits. Search interest shows what people look for, not who is searching, and lower interest does not mean lower need. The next main NAEP math results are expected in early 2027; the analysis will be updated when they are released.
Is Your Child Keeping Up in Math?
Book a free lesson and see where your child’s math skills stand. 

Explore Brighterly Learning Experience
Learn exactly how Brighterly helps students thrive through expert sessions, online tools, and proven feedback from thousands of satisfied parents
Families Are Searching for Math Help More Than at Any Point in Five Years
Interest in the term “math help” has risen every fall since 2022, and the steepest jump came between 2024 and 2025. The highest week in the five-year series was the week of September 20, 2026, a few weeks into the school year.
Search interest follows the school calendar. Interest in September runs 3.1 times higher than in July, and it stays high through the spring before it falls away in summer. Searches for “homework help” followed the same path, up 32% since fall 2022.
What families are searching for has shifted. Interest in “math tutor” was flat over the same five years (down 1%). The growth is in the broader ask for help.
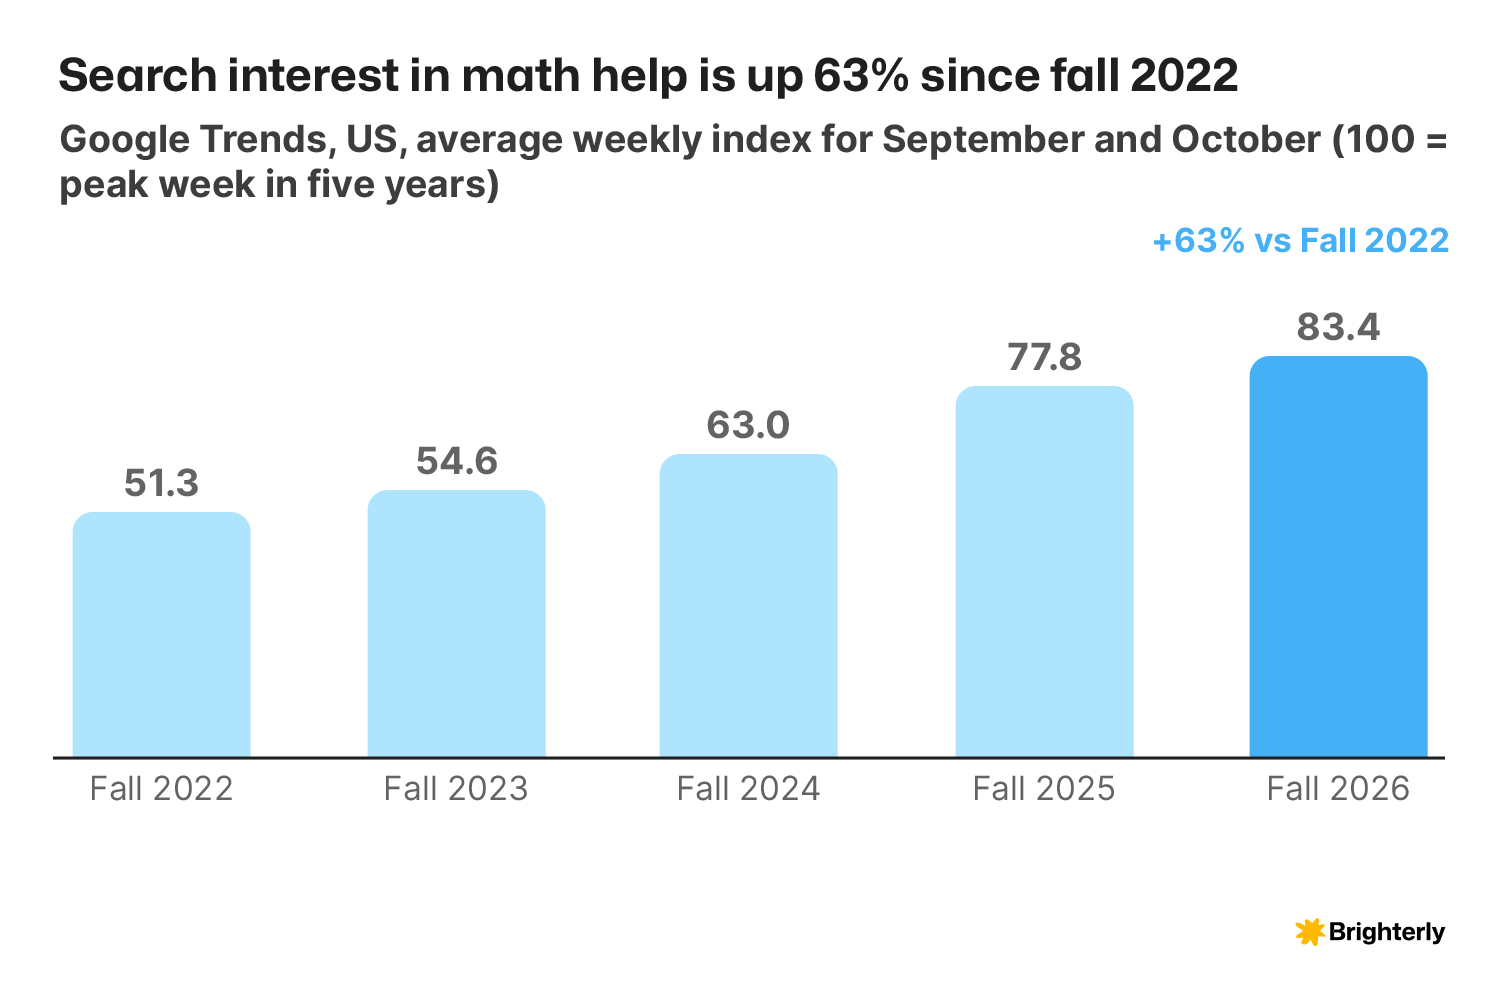
Google Trends, ‘math help’, United States, Nov 2021 to Nov 2026
Math Gets Harder Every Grade, and Middle School Took the Biggest Hit
The share of students without basic math skills climbs with every grade NAEP tests: one in four 4th graders, four in ten 8th graders, and nearly half of 12th graders. Since 2019, that share rose fastest in 8th grade, by 9 points, about twice the rise in 4th or 12th grade.
4th 20% 24% +4 pts 39% 8th 32% 41% +9 pts 27% 12th 40% 45% +5 pts 21%
Grade
Below NAEP, 2019
Below NAEP Basic, 2024
Change
Proficient or above, 2024
Learning loss statistics: public schools, national. NAEP tests math in grades 4, 8, and 12 only; state results exist for grades 4 and 8.
The drop shows up in every part of 8th-grade math, not in one hard topic.
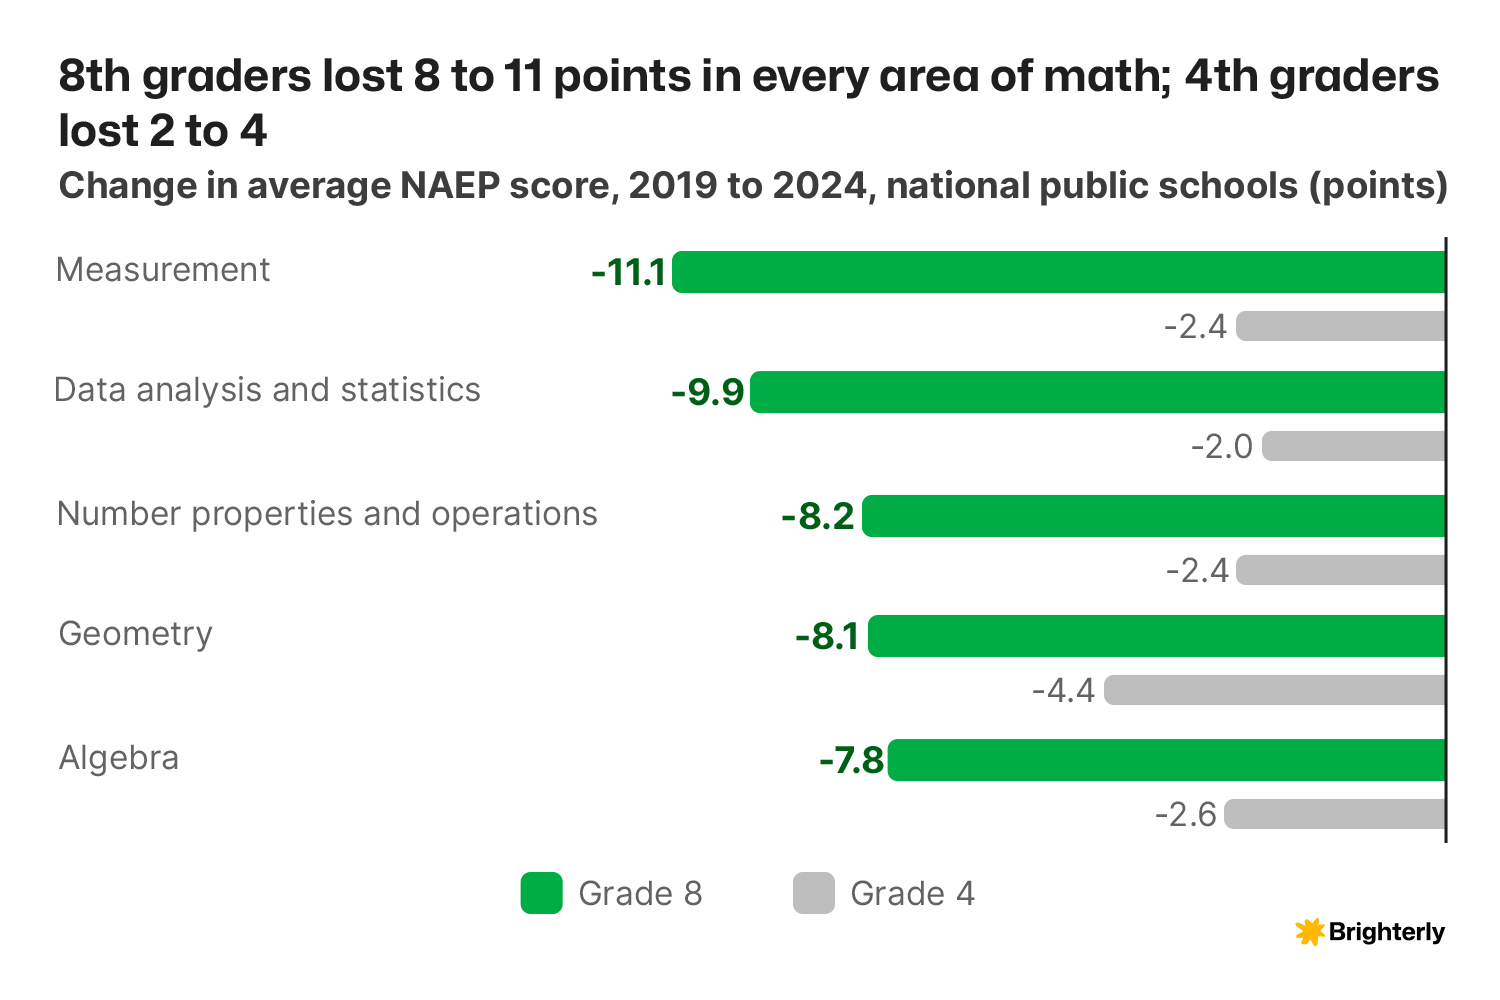
NAEP Data Service, mathematics subscales MRPS1-MRPS5, national public, 2019 and 2024
Math test scores by state show 8th graders fell further than 4th graders in 50 of 51 jurisdictions; Nebraska is the only exception. The math score decline hit all five areas of 8th-grade math in every state and DC. Measurement fell furthest (down 11.1 points) and was the steepest drop in 28 states.
Strong elementary results do not protect middle schoolers. In Massachusetts, the top-scoring state, 4th graders held steady (down 0.8 points) while 8th graders lost 11 points. Michigan (down 1.0 vs 10.3) and West Virginia (no change vs down 11.5) show the same split.
In four Southern states, the share below Basic more than doubles between 4th and 8th grade. Florida’s 4th graders are among the strongest in the country, with 18% below Basic; among its 8th graders, the share is 45%. Mississippi (19% to 43%), Texas (21% to 44%), and Alabama (24% to 50%) follow the same pattern. These are different groups of students tested in the same year, so the gap shows where the system loses ground, not one class falling behind.
The weakest students fell furthest. An 8th grader at the 10th percentile scored 11.9 points lower than in 2019; at the 90th percentile, the drop was 5.5 points.
Searches turn upward in middle school and grow fastest in high school. Searches like “4th grade math” are mostly for worksheets, tests, and practice, the kind of study-material search that fell across the board as AI tools took over (see the next section). Against that decline, interest turns upward from the 7th grade and grows fastest in high school.
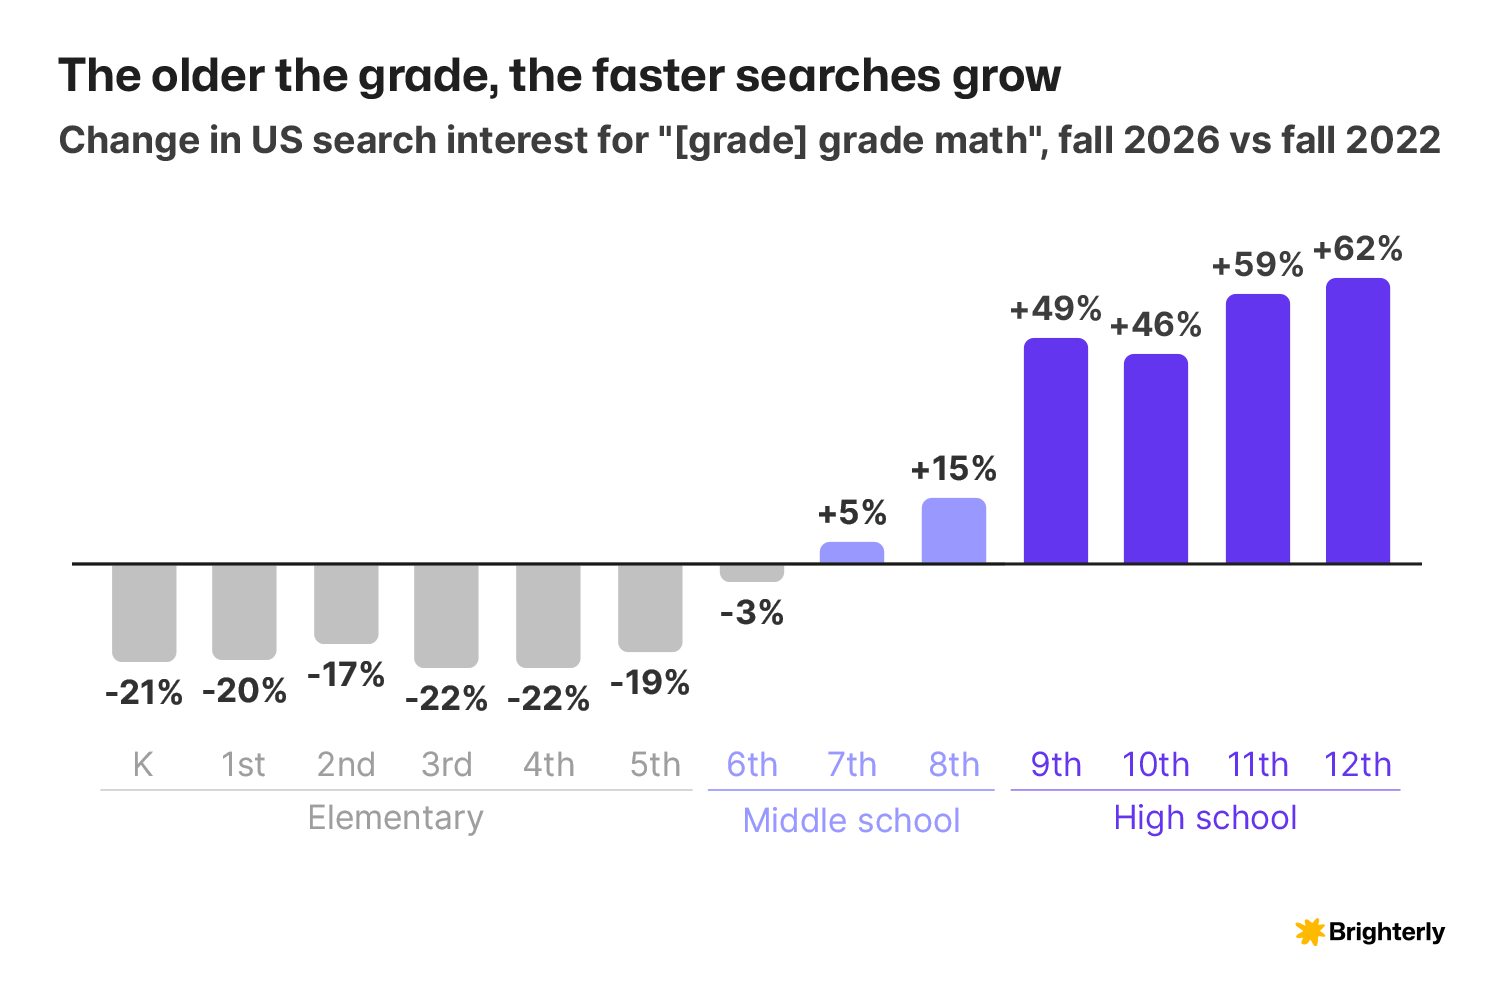
Google Trends, United States, Sep-Oct averages, pulled 8 Nov 2026
Interest in every grade from kindergarten to 5th fell by 17% to 22%. It flattens at 6th grade, grows at 7th (up 5%) and 8th (up 15%), and rises by 46% to 62% for each high school grade. Families are trying to work out what each grade expects: the top related search for 8th grade is “what is 8th grade math“, and “is Algebra 1 9th grade math” is the fastest-rising search linked to 9th grade.
High school searches start from a smaller base: “9th grade math” draws about a third as much interest as “8th grade math” because older students mostly search by course. Searches for “Algebra 1” and “Algebra 2” fell by about 20% since 2022, in line with other study materials.
The newest federal data shows the same split by age. The NAEP Long-Term Trend results released in June 2026 found that 9-year-olds gained 4 points in math since 2022, while 13-year-olds were unchanged and still about 10 points below pre-pandemic levels.
Why are math scores declining? Educators point to hidden gaps. Here’s what Claire Smizer, Educational Advisor at Brighterly, shares:
“Every fall I can tell within a few weeks which students are going to struggle, and it’s rarely the new topic that trips them up.”

Find the Gap Before the Test Does
A free 1:1 lesson helps pinpoint which basics need work first.
Inside Brighterly: Middle Schoolers Start Further Behind
Brighterly’s own assessment data shows the same gap. On their first math assessment with Brighterly, 41% of students in grades 6-8 needed support on at least half of the skills tested, compared with 30% of students in grades 3-5.
Brighterly internal data: first math assessment of 446 students in grades 6-8 and 778 in grades 3-5. These families chose tutoring, so the figures describe Brighterly students, not all US students.
Families Stopped Searching for Answers, but Not for Help
Searches for how to solve specific math problems collapsed over the same period that searches for “math help” rose 63%. All 24 common topic searches tracked, from kindergarten to 10th grade, have fallen since fall 2022. The median drop was 37% for elementary topics, 39% for middle school, and 30% for high school.
The steepest falls were in 8th-grade topics, the same grade where test scores slid the furthest.
how to find slope 8 -56% systems of equations 8 -51% scientific notation 8 -48% how to multiply fractions 5 -46% how to divide fractions 5-6 -45% quadratic formula 9 -42% math help all +63%
Search
Typical grade
Fall 2026 vs fall 2022
Tools for self-study are fading too. Interest in “math worksheets” fell 31% in the past year, and “Mathway” has dropped close to zero. “ChatGPT math” fell 46% from fall 2025, a steeper drop than “ChatGPT” overall (down 21%).
One likely reason is that answers now come straight from AI tools, without a Google search first. Yet the broad search for help continues to grow. Part of that help now comes from AI as well: “math help ai” is among the fastest-rising searches related to “math help”. The searches that keep growing ask for math help for struggling students, not for the answer to one problem.
The Math SOS Map: Math Scores by State, Where the Struggle Is Loud and Where It Is Silent
The states with the weakest math results are not always the ones searching hardest for help. Across the states, NAEP need and search interest are only weakly linked (correlation 0.2). Comparing the two sorts, every state is classified into one of four groups. The table below shows each state’s need and search interest.
Sounding the alarm Above-median need, above-median search New Mexico, Delaware, Maryland, Arizona, Oklahoma, Nevada, California, Virginia, New York, Washington, Georgia, Texas Struggling in silence Above-median need, below-median search DC, Alaska, Oregon, West Virginia, Arkansas, Maine, Michigan, Missouri, Vermont, Pennsylvania, Connecticut, South Carolina Searching ahead Below-median need, above-median search North Carolina, Utah, Mississippi, Louisiana, Kansas, Alabama, Florida, New Jersey, Idaho, Hawaii, Indiana, Nebraska, Wyoming* Steady Below-median need, below-median search Massachusetts, Minnesota, New Hampshire, North Dakota, South Dakota, Wisconsin, Montana, Ohio, Colorado, Iowa, Illinois, Tennessee, Kentucky, Rhode Island
Group
What the data shows
States
*Wyoming’s search data is volatile because of its small population.
New Mexico has the highest need in the country. 58% of its 8th graders and 38% of its 4th graders score below the NAEP Basic level, the highest shares of any state.
DC and West Virginia are struggling in silence. More than half of their 8th graders score below Basic (54.5% and 51.6%), yet both rank in the bottom half for search interest, and West Virginia is tied with Wisconsin for second-lowest in the country.
Oregon is the starkest silent case. Scores fell in all five areas in both grades, including the largest single drop in the country (8th-grade measurement, down 17.1 points). Oregon is among the lowest states for search interest (12th- or 13th-lowest of 51, tied with Kentucky).
Maine searches least of any state for math help, while its 8th-grade scores have fallen 9.8 points since 2019.
Low search interest does not mean parents care less. It can reflect internet access, language, or help that comes through schools rather than search engines.
Cities: The Sun Belt Searches for Help, the Coasts Search for a Tutor
Among the 54 largest US media markets, Charlotte ranks first for search interest in math help over the past 12 months. Oklahoma City, Raleigh-Durham, Dallas-Fort Worth, Houston, Fresno, and Salt Lake City rank in the top ten over both the past year and the past five years.
1 Charlotte, NC San Francisco-Oakland-San Jose, CA 2 Oklahoma City, OK Washington, DC 3 Raleigh-Durham, NC New York, NY 4 West Palm Beach, FL Los Angeles, CA 5 Salt Lake City, UT and Austin, TX (tied) San Diego, CA
Rank
Most interest in “math help”(past 12 month)
Most interest in “math tutor”(5 years)
Interest is lowest in Buffalo, Boston, and Providence, followed by Hartford-New Haven, Minneapolis-St. Paul and Tampa.
The two searches map different parts of the country. Across the big metros, five-year interest in “math help” and “math tutor” is almost unrelated (correlation 0.04). Families in the largest coastal cities search for a tutor; families across the Sun Belt search for help.
Bright Spot: Alabama Shows the Slide Can Be Reversed
Alabama is the only state where 4th graders improved in all five areas of math between 2019 and 2024, with gains of 2.6 to 8.3 points. Its 4th-grade average rose 6.7 points, the largest gain in the country, while the national average fell 2.7 points.
The gains followed the Alabama Numeracy Act, passed in 2022, which placed math coaches in K-5 schools statewide and added targeted help for struggling students.
The recovery has not reached middle school yet. Alabama’s 8th graders lost 6.9 points, and half of them (50.4%) scored below NAEP Basic.
Expert Comment
Eugene Kashuk, CEO at Brighterly, comments.
“Middle school is when math stops being about getting the answer and starts being about understanding why.”
For Parents Who Ask How to Help Their Child with Math
- Watch the jump to 6th and 7th grade. The data shows the steepest losses occur in middle school, so ask about gaps before 8th grade, not after.
- Ask your child to explain one problem out loud each week. If they can solve it but not explain it, the answer likely came from somewhere else.
- If your child is struggling with math, check the basics behind the new topic. Slope and equations rest on fractions and ratios; a gap there often looks like trouble with Algebra.
- Get help early in the school year. Search interest peaks in late September, weeks before the first report cards. Look for math resources for parents, such as grade-level guides and practice sets, to spot gaps early.
Conclusion
Math struggles are growing, and middle school is where they hit hardest. Since 2019, 41% of 8th graders have fallen below NAEP Basic, with scores down in every state, and the weakest students lost the most. Families are responding by searching for help rather than answers, with interest peaking each September. The gaps behind these scores are usually fractions and ratios from earlier grades, which is why catching them early matters.
Is your child struggling with math? Brighterly’s tutors find the root gap and rebuild confidence, one step at a time. Book a free lesson and test our approach yourself.
Frequently Asked Questions
Where Can I Find NAEP Scores by State?
NAEP scores by state are published through the NAEP Data Service API on the Nation’s Report Card site. State results exist for grades 4 and 8 only. This analysis compares 2019 and 2024, and the next main NAEP math results are expected in early 2027.
What Does Below NAEP Basic Mean?
NAEP Basic is the lowest of three achievement levels set by the National Assessment Governing Board (NAGB). It marks partial mastery of the skills students need to reach NAEP Proficient, which NAGB describes as solid academic performance. Students below Basic haven’t reached even partial mastery. For 8th graders, NAGB says that likely means they can’t yet use similarity to find a triangle’s missing side.
Have US Math Scores Recovered Since the Pandemic?
Only in part. On the 2024 NAEP, 4th-grade math scores rose from 2022, but 8th-grade scores stayed flat, and both grades remained below their 2019 averages. Gains have reached younger students first, so middle school is where recovery is slowest. That makes 8th grade the main gap to watch when the next results are released.


If you are looking for a platform to switch from Huntington, its main competitors differ based on their learning formats, ranging from dedicated 1:1 tutoring help to ACT/SAT test prep intensives. This guide compares the 7 best Huntington Learning Center alternatives based on their format, pricing model, and the type of learner they suit best. […]

Nov 19, 2026
MAP test practice can help your child feel more confident on test day. This guide provides sample MAP questions with answers and explanations, a simple 4-week prep plan, and links to further MAP growth test practice. MAP Growth at a Glance Explore Brighterly Learning Experience Learn exactly how Brighterly helps students thrive through expert sessions, […]

Nov 20, 2026
Math & reading from 1st to 12th grade
Looking for homework support for your child?

Choose kid's grade

Math & Reading for Grades 1–12
Build real confidence for your child with a Brighterly math or reading tutor.