Systems of Inequalities Worksheet
Updated on October 20, 2026
Systems of inequalities worksheets help students practice graphing two or more inequalities on the same coordinate plane and identifying the region that satisfies every condition. Brighterly’s printable worksheets reinforce boundary lines, shaded half-planes, test points, and overlapping solution regions. Students who need to review a single inequality first can start with graphing linear inequalities worksheets.
Systems of Inequalities Worksheets PDF: Examples
Brighterly’s systems of inequalities worksheets help students move from solving individual inequalities to graphing several constraints together. Learners draw each boundary line, determine which side of the line satisfies the inequality, shade the correct region, and then identify where all shaded areas overlap.
That overlapping region represents every ordered pair that satisfies the entire system rather than just one inequality.


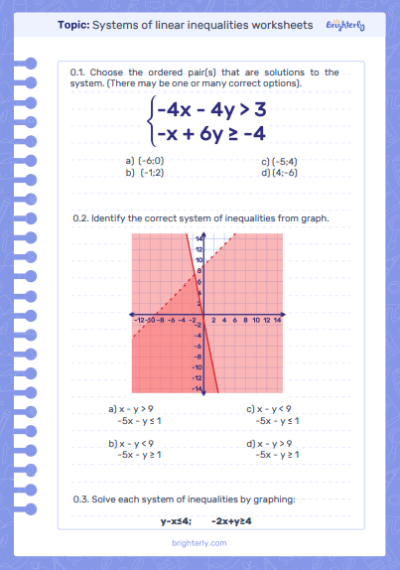
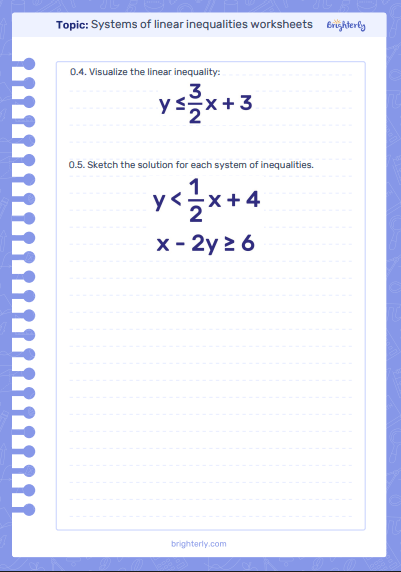
Systems of Inequalities Worksheets [Download for Free]
Download and print Brighterly’s free systems of inequalities worksheets for additional algebra practice at home or in class. Students can work through graphing problems, compare shaded regions, and use the included answers to review mistakes. Worksheets 1–4 cover systems of inequalities generally, while Worksheets 5–7 focus specifically on systems made up of linear inequalities.
Encourage students to graph each inequality separately before looking for the common solution region. This makes it easier to see whether an error comes from the boundary line, the shading direction, or the final overlap.
If systems of inequalities still feel confusing, your child can work with an algebra tutor or a 9th grade math tutor for personalized support with graphing, inequalities, and other Algebra 1 skills.


How strong are your algebra skills?
A quick quiz can reveal which algebra skills need more practice
Students who are still learning how to graph one inequality can begin with graphing linear inequalities worksheets. These exercises focus on boundary lines, test points, and shading one half-plane at a time.
For broader practice with expressions, equations, functions, and inequalities, explore Brighterly’s algebra worksheets collection.
Benefits of Systems of Inequalities Worksheets
Graph Each Inequality Separately
A system becomes easier to understand when students treat each inequality as its own graph first. They identify the boundary line, draw it correctly, and determine which side of the line contains the solutions.
Only after each inequality is graphed do students compare the shaded regions to find the solution to the complete system.
Choose Solid or Dashed Boundary Lines
The inequality symbol determines whether points on the boundary are included in the solution set. Students use a solid boundary for ≤ or ≥ because equality is allowed.
For < or >, the boundary is dashed because points directly on the line do not satisfy the inequality.
Practice Shading the Correct Half-Plane
After drawing the boundary, students need to decide which side of the line satisfies the inequality. A test point such as (0, 0), when it is not on the boundary, can often be substituted into the inequality to check which region should be shaded.
More focused practice with this skill is available in graphing inequalities worksheets, which emphasize choosing the correct boundary and shaded region.
Identify the Overlapping Solution Region
The solution to a system is the set of points that satisfies every inequality at the same time. On a graph, this appears where the shaded regions overlap.
This is an important difference from a system of equations, where the solution may be an intersection point. With inequalities, the solution can be an entire region containing many ordered pairs.
Check Whether a Point Satisfies the System
Students can test a specific ordered pair by substituting its x- and y-values into every inequality in the system. The point belongs to the solution set only if it makes all the inequalities true.
This provides a useful algebraic check when a graph is difficult to interpret or when a point lies close to a boundary.
Translate Constraints Into Inequalities
Systems of inequalities can represent situations with several conditions at once. A word problem might include a spending limit, a minimum quantity, or another restriction that can be written as an inequality.
Students translate each condition separately and then use the system to identify values that satisfy all of the restrictions together.
Prepare for Systems and More Advanced Algebra
Graphing systems of inequalities combines coordinate-plane skills with algebraic reasoning. Students need to understand linear relationships, inequality symbols, and graphing before they can interpret overlapping solution regions confidently.
Comparing this topic with system of equations worksheets can also help learners understand the difference between finding intersection points and finding shared regions.
How to Use Systems of Inequalities Worksheets
Start by taking one inequality from the system and rewrite it in a graph-friendly form if necessary. Draw its boundary line and decide whether the line should be solid or dashed.
Next, use a test point to determine which side of the boundary should be shaded. Repeat the process for every inequality in the system.
When all inequalities have been graphed, identify the area where every required shaded region overlaps. That shared region represents the solution set.
Finally, choose a point inside the overlap and substitute its coordinates into every inequality. If each statement is true, the point satisfies the system.
Students who need more practice solving individual inequalities before graphing a system can use multi-step inequalities worksheets to review isolating variables and inequality rules first.
Frequently Asked Questions
What Skills Do Systems of Inequalities Worksheets Help Students Practice?
Systems of inequalities worksheets help students practice drawing boundary lines, graphing inequalities on a coordinate plane, choosing solid or dashed lines, shading solution regions, using test points, and identifying where multiple solution regions overlap.
What Is the Solution to a System of Inequalities?
The solution is the set of points that satisfies every inequality in the system. On a coordinate graph, this is usually shown as the region where the shaded solution areas of all the inequalities overlap.
How Do You Graph a System of Inequalities?
Graph each inequality separately by drawing its boundary line and shading the correct side. Repeat this for every inequality in the system. The final solution is the region that satisfies all the inequalities at the same time.
When Do You Use a Solid or Dashed Line for an Inequality?
Use a solid boundary line for inequalities containing ≤ or ≥ because points on the line are included. Use a dashed line for < or > because the boundary itself is not part of the solution.
Do Brighterly Systems of Inequalities Worksheets Include Answers?
Yes. Brighterly’s systems of inequalities worksheets include answers so students can review their graphs and identify mistakes involving boundary lines, shading directions, test points, or overlapping solution regions.


Need help with Inequalities?

- Does your child need extra support with understanding inequalities?
- Start lessons with an online tutor.
Choose kid's grade

Is your child finding it hard to master of inequalities? An online tutor could be of help.
Book FREE lesson