Summer Slide Statistics 2026
reviewed by Franz Jerby Delos Santos
Updated on July 21, 2026
Key Points: Summer slide statistics for 2026 show that kids tend to lose their knowledge and academic skills during summer break, especially in math. However, the exact stats differ not only by subject but by grade. According to the EBSCO 2025 article, summer slide is a term that educators use to describe the loss of knowledge that students experience during summer break. The summer slide definition also implies that there is a clear test score decline that happens in a period from spring to fall. Note: Other terms for summer slide that mean the same thing include summer learning loss, summer setback, or summer brain drain. The initial summer slide meaning is based on the 1996 research published in Review of Educational Research, which found that test scores decline after summer vacation as kids lose about one month worth of knowledge. However, although the summer slide relies on differences in test scores before and after the summer break, the NWEA April 2026 data also found that there are specific skills that fade especially fast during the same period — isolated facts, vocabulary, multi-step tasks, and procedural skills.
Help your kid learn during summer
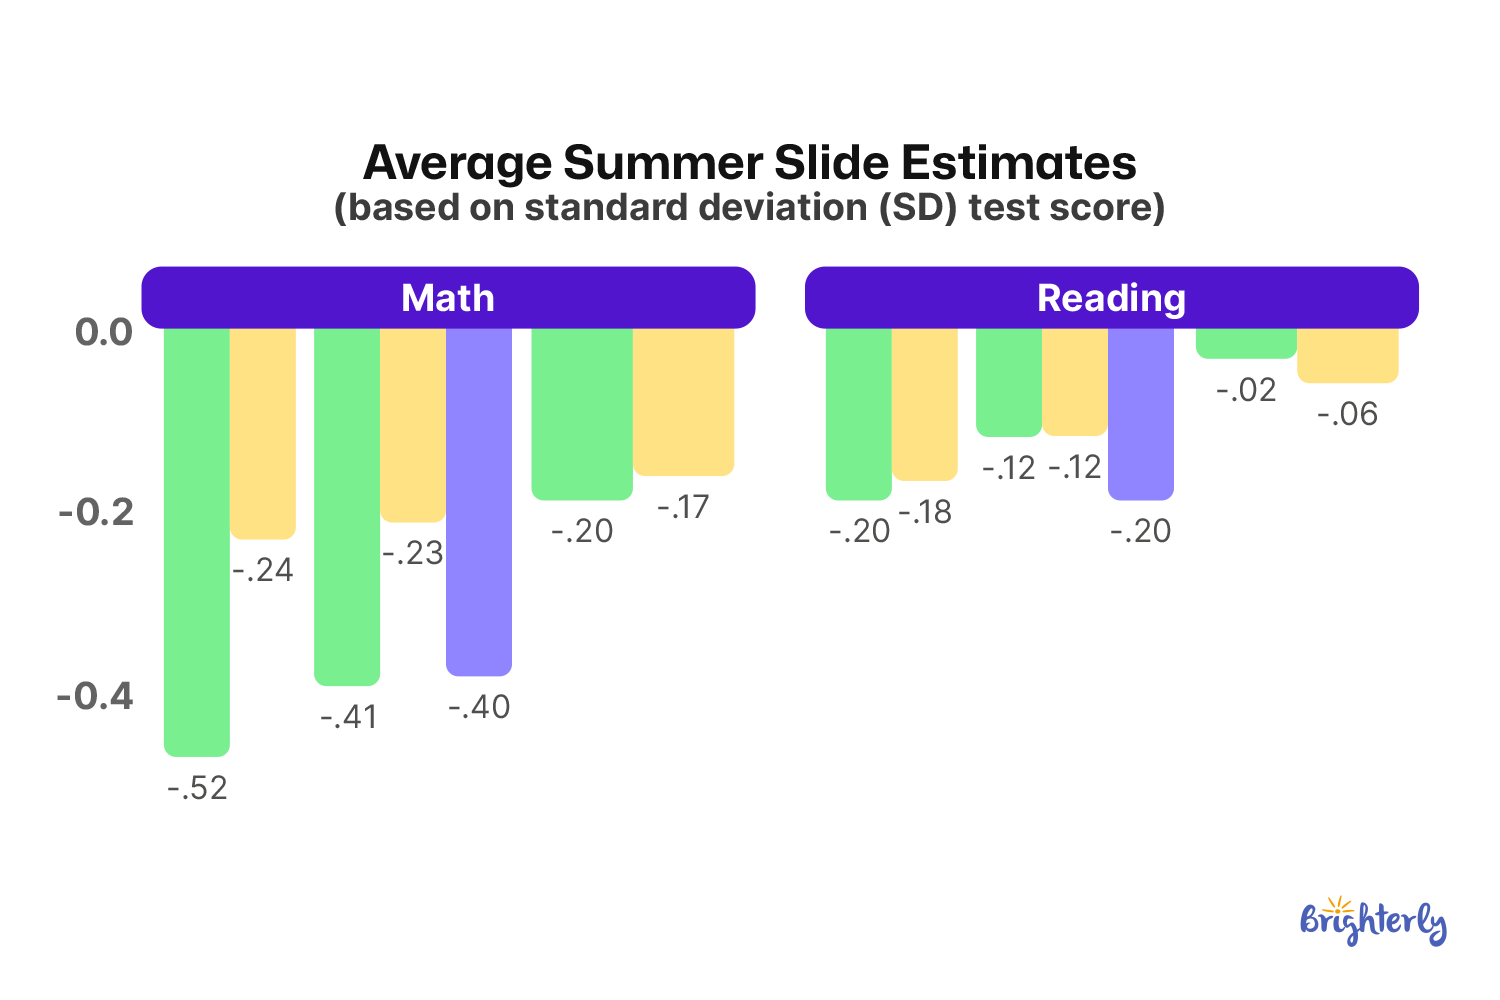
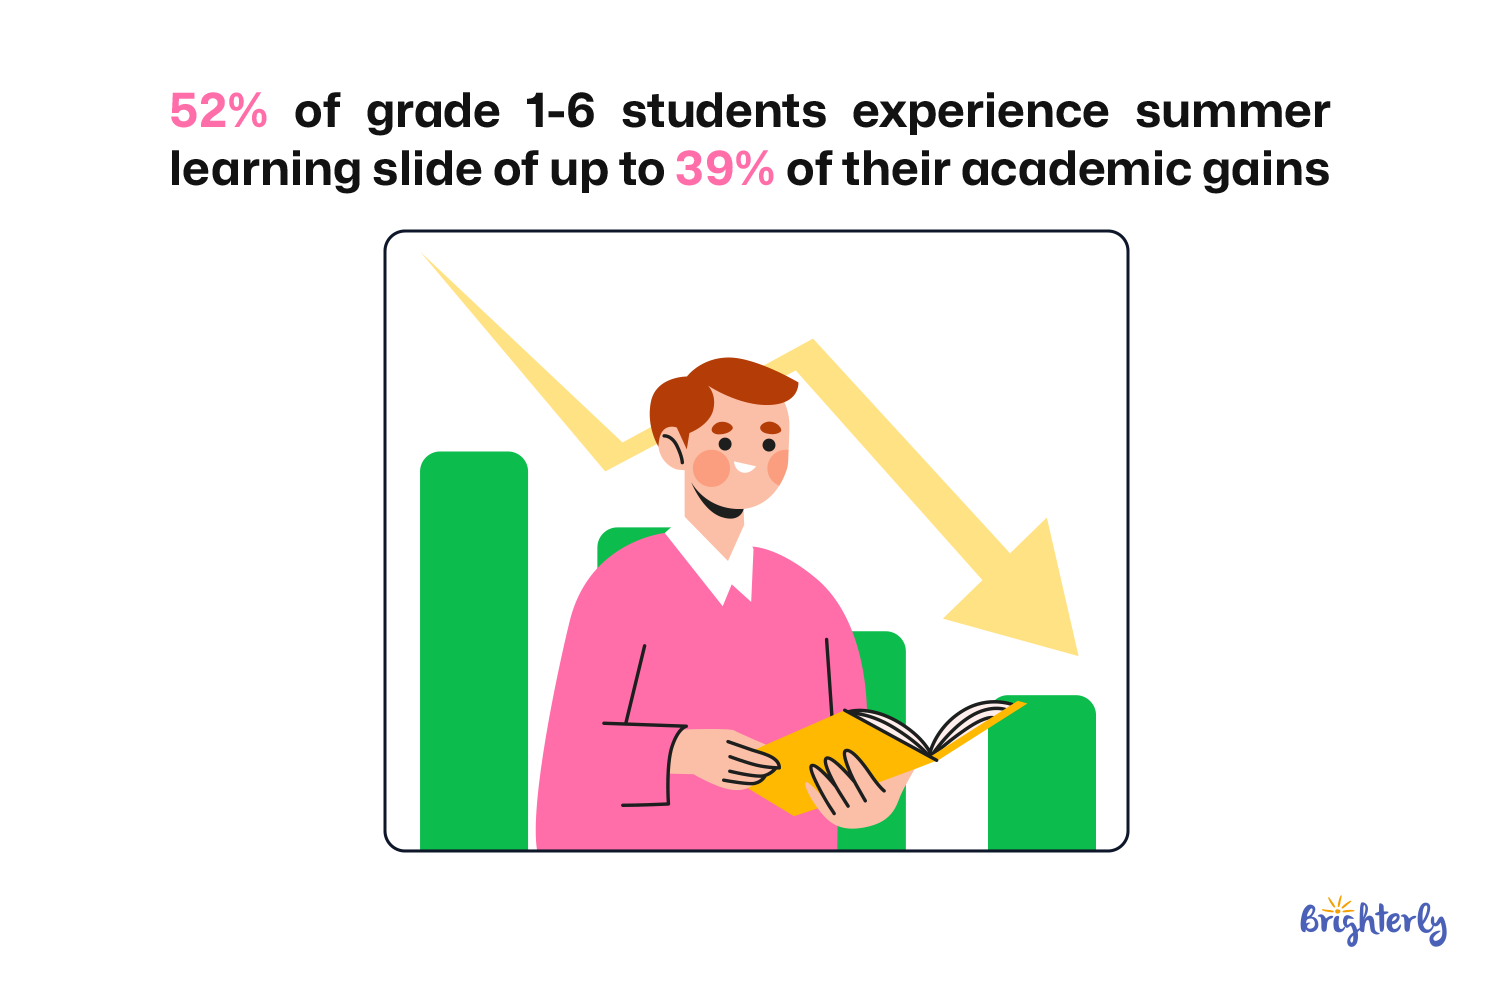
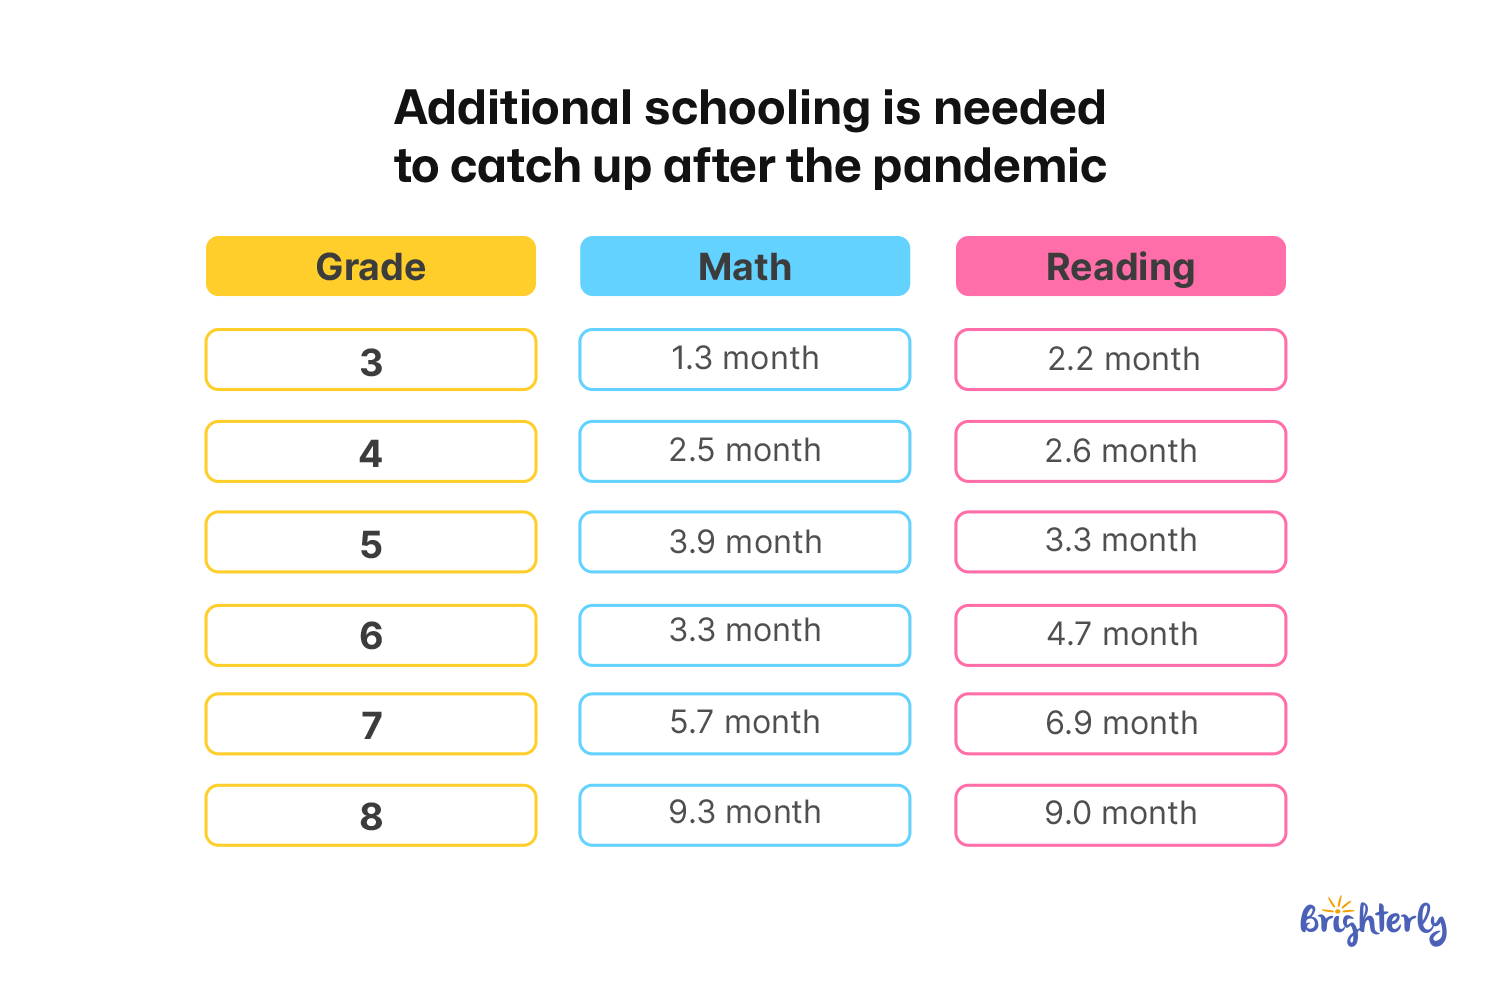
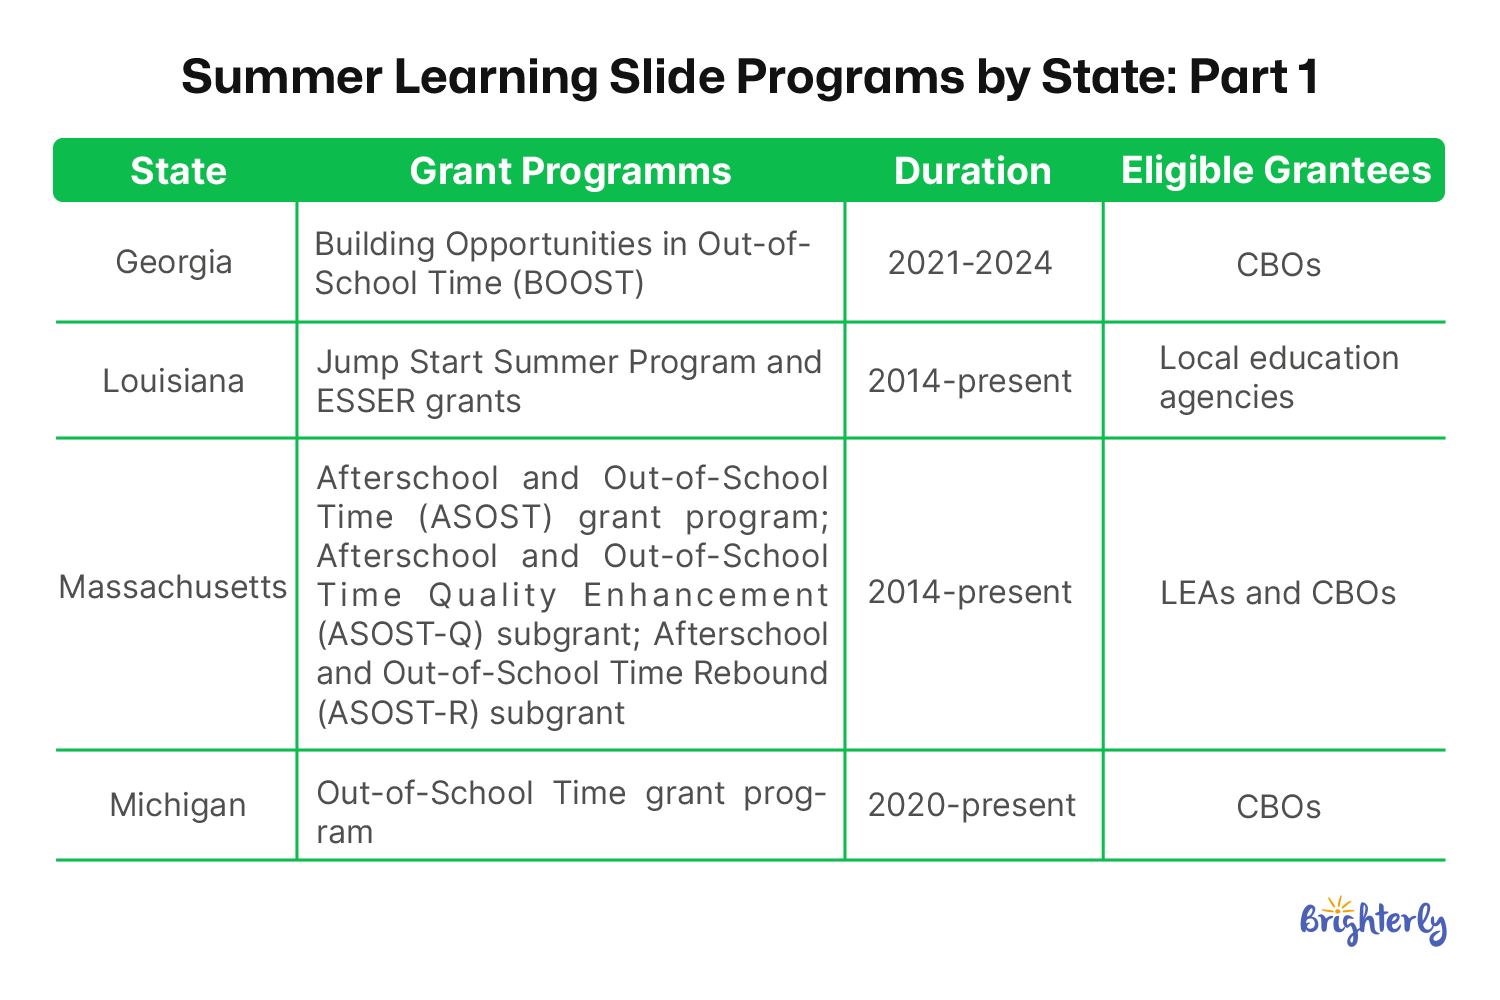
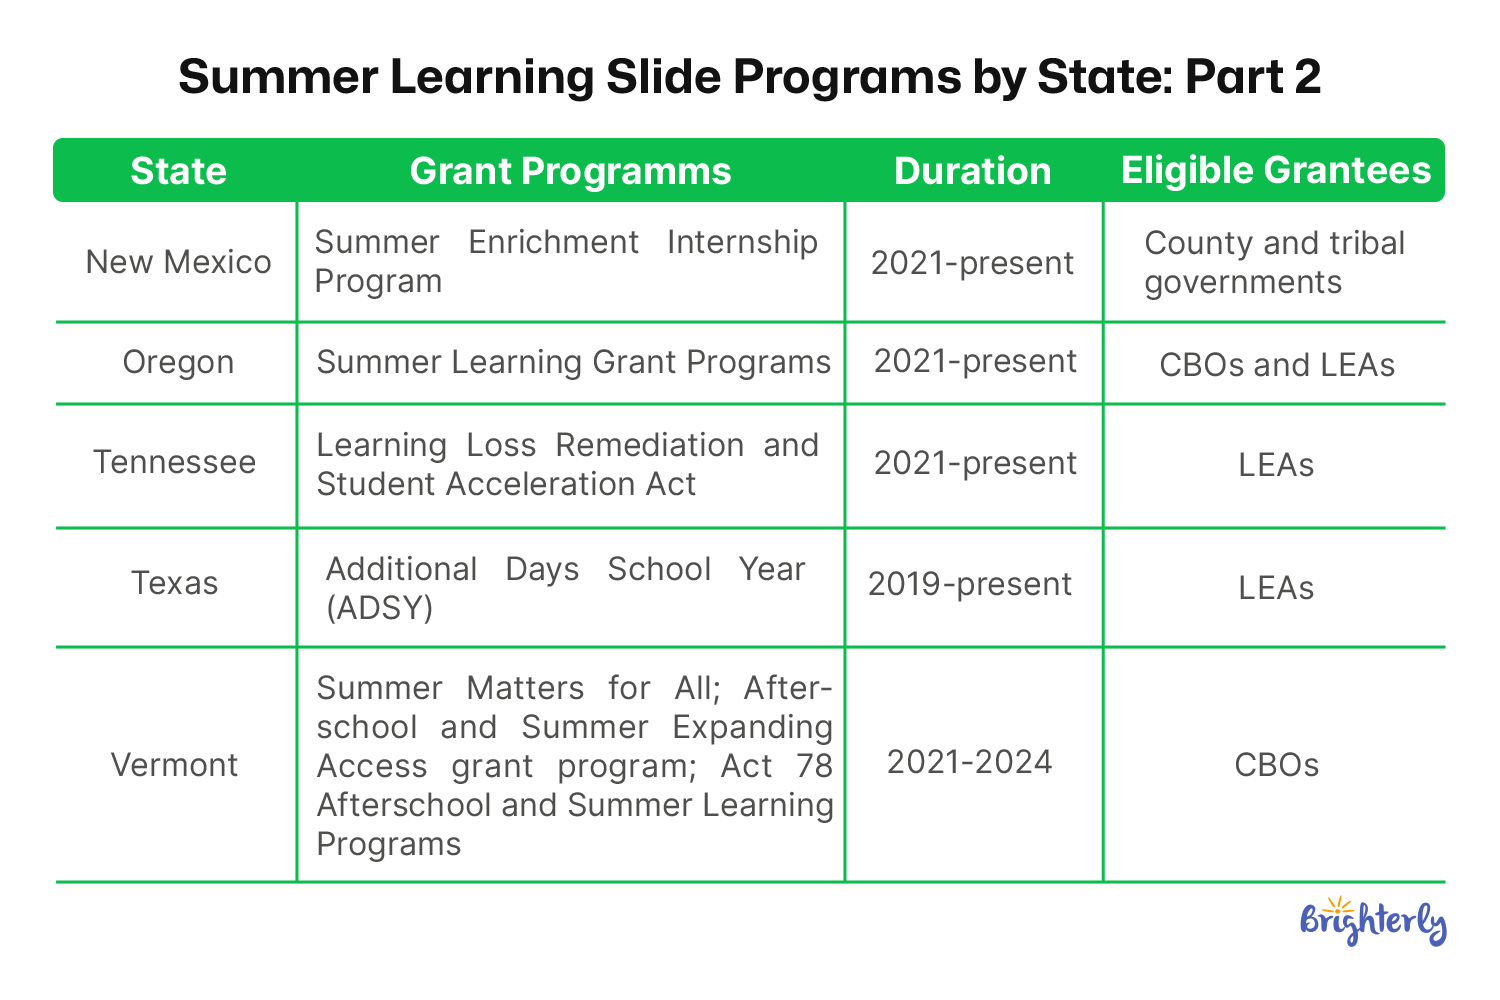
Our tutors help a child retain knowledge and fill their specific learning gaps. Explore Brighterly Learning Experience Learn exactly how Brighterly helps students thrive through expert sessions, online tools, and proven feedback from thousands of satisfied parents Statistics on summer slide from 2018 through 2026 show two clear patterns — learning loss in math is consistently larger than learning loss in reading, and the COVID-19 pandemic had a severe effect on widening the learning gap even in post-pandemic years. Statistics for 2018-2021 show a pattern in the loss of student achievement — students lose a big chunk of academic knowledge every summer, primarily in reading and math. The math losses are generally higher, with 2-3 months worth of knowledge lost in math against 1-2 months in reading. Summer slide statistics 2018 Summer slide statistics 2019 Summer slide statistics 2020 Summer slide statistics 2021 On average, English language summer loss is between 17% and 28% of information gained during the previous school year (data for 2008-2016, American Educational Research Journal, April 2021) Summer slide is more complex than just socioeconomic status and is not inevitable. Data shows that 22% to 38% of 3.4 million NWEA MAP Growth assessment students gained during summer (NWEA, 2019) English language summer loss affects 52% of students, based on the analysis of 200 million test scores for around 18 million students (AERA, 2021) Isolation during the pandemic caused an average loss of 0.4 years of schooling (Federal Reserve Bank of Richmond, 2023) The average math student loses between 25% and 34% of the gains they make during the school year over the summer (data for 2008-2016, American Educational Research Journal, April 2021) Students volume of knowledge gained during the previous school year impacts summer slide more than race/ethnicity — 22 and 39% explanation to only 1% (NWEA, 2019) On average, summer slide in reading during summer equals 1-2 months and can increase even more after the pandemic (NWEA, 2020) Only 37% of math losses were recovered by the end of 2022 (NBER 2023) Children from poor households receive less regular care from someone other than their parents the summer after kindergarten — 83% compared to 70% non-poor ones (NCES, 2018) Access to summer programs, length of the school year, and test disengagement after summer can be other possible explanations for summer slide (NWEA, 2019) On average, the math loss during summer equals 2-3 months and can increase even more after the pandemic (NWEA, 2020) Losses in reading are 2 ISIP points in K-1 and 30-40 ISIP points for grades 3-5. In math, the loss is 25-37 ISIP points across grades K-5 (Istation, 2021) Summer learning loss statistics for 2022-2026 show the same pattern as 2018–2021 data — summer slide is bigger in math than reading, with over 70% of kids lacking knowledge necessary to start 5th grade math. To catch up and reach their grade level, students have to learn almost three times faster. Summer slide statistics 2022 Summer slide statistics 2023 Summer slide statistics 2024 Summer slide statistics 2025 Summer slide statistics 2026 In the summer of 2022, roughly 90% of school districts offered academic-focused summer programs to help prevent summer slide (NWEA, 2026) On the NWEA tests, children lost between 0.3 and 0.5 standard deviations (SD) over the summers, an amount equivalent to 2 to 3 months of school-year learning (Sociological Science, 2023) On the NWEA tests, reading gaps increased by 36% during 2023-2024, and math gaps increased by 18% (NWEA, 2024) Summer learning programs are still popular — 82% of superintendents plan to maintain or increase spending on these programs (AASA, 2025) Over the summer break, the average student loses from 10% to 30% of their math knowledge gained in the previous school year (NWEA, 2026) Math loss increases grade by grade, with grade 6-7 students losing 30–40% of their school-year gains (University of Colorado Boulder, 2022) Summer slide is still affected by the pandemic loss, which equaled 0.17 grade levels in math learning loss between 2022 and 2023 (Center for Education Policy Research, 2024) Summer learning programs are among the most popular strategies to combat summer slide by state schools — $5.8 billion of ESSER funding is expected to be spent on them by fall 2024 (FutureED, 2022) Students starting the 5th grade in the fall are already behind and not ready for 5th grade math — 72% of students in 2024 compared to 65% in 2019 (NWEA, 2026). For some children, summer slide is much worse than for others — for 10% of students who experience the worst summer slide, learning loss can amount to over a year worth of knowledge in both math and reading (NWEA, 2026) Summer loss is around 10-20% compared to the previous year’s gains. The higher the grade, the higher the average loss is (University of Colorado Boulder, 2022) Test results differ: in reading, between the fall of kindergarten and the spring of second grade, the SD grew by 38% on the NWEA test but shrank by 25% on the ECLS-K:2011 test (Sociological Science, 2023) The Progress Learning survey of around 1000 teachers showed that 63.6% of educators agreed that summer slide exists. Only 31.3% believed their students were not affected by it (Progress Learning, 2024) To make up for learning loss after summer break, an average struggling 5th has to learn roughly 3 times faster (2.7) to catch up to their grade level in one school year (NWEA, 2026). Only 1 out of every 3 schools has successfully returned to its pre-pandemic learning levels in either math or reading — 1 out of 7 has recovered in both subjects (NWEA, 2026) Overall, different summer slide research for the years 2018-2026 shows that kids lose more knowledge in math than in reading during the summer break. Before 2021, the average knowledge loss in math was 2-3 months compared to 1-2 months in reading. The current April 2026 NWEA data shows this trend is still relevant, with math scores dropping or flattening more than reading scores during summer. Source: NWEA, 2026 Another trend that the 2018-2026 statistics show is that the COVID-19 pandemic made the summer slide even worse, costing students nearly half a school year (0.4 years) worth of knowledge due to isolation. However, 2026 data shows a slow post-pandemic recovery, with 1 out of 3 schools returning to the knowledge levels in either reading or math they had before the pandemic. The most relevant summer slide percentage data from the July 2020 AERA research says that 52% of 1st through 6th graders experience summer slide, while losing an average of 39% of their total school-year gains over the course of each summer. Statistics on summer learning loss in math and reading from 2018 to 2026 show that kids consistently lose far more math skills than reading skills over the summer. The explanation for this trend seems to be that kids read during the summer much more than they practice math. Claire Smizer, Brighterly Educational Advisor, also agrees with this explanation: “Reading keeps happening on its own — texts, captions, game dialogue, street signs, a book at bedtime.” Year Reading Summer Slide Statistics Math Summer Slide Statistics Notes Source 2018–2021 17–28% loss (English language) 25–34% loss Students who make the largest academic gains during the school year often experience the worst summer slide 2022–2024 Smaller drops than usual 0.02 to 0.06 SD average drop District-funded summer programs helped slow down summer learning loss post-pandemic 2025 Flat / Near 0 RIT points lost 2 to 7 RIT points lost Math scores dropped across grades 3–8 while reading scores stayed mostly the same due to kids practicing reading more than math at home 2026 Under 1 RIT point average change 10–30% of a year’s gain (2–7 RIT points) Reading loss may be lower because kids tend to read duling summer break more than to do math Math summer slide statistics from the July 2020 AERA research show that students typically lose 25%-34% of their school-year math skills over the summer, while the newest NWEA April 2026 data narrow these numbers to 10%-30% of lost math knowledge, with the biggest loss in elementary grades. The NWEA April 2026 data also indicates that one possible explanation for math skills fading over summer is that kids are more likely to read in summer than to practice math. Also, math requires procedural skills that are recalled faster than those needed for reading. Note: A summer math camp can help kids preserve procedural skills during summer break and prepare for the next school year. Tara West, teacher-author at hand2mind and Developer of Little Minds at Work, also agrees that math skills require more effort to retain during summer: “Math usually requires more intentional practice.” Summer reading slide statistics from July 2020: AERA research shows that students lose 17% to 28% of their ELA skills during the summer break, including reading skills. As for the current data, the April 2026 NWEA statistics show that average reading scores barely change between spring and fall (less than one RIT point change). However, 10% of kids who experience the worst summer slide in general can still lose over a year’s worth of skills in reading. Adding to summer reading loss statistics, Dr. Emily Levy, the founder and director of EBL Coaching, at EBL Coaching also shares that when struggling kids experience a bigger summer slide, they may require guidance: “Many students show significant regression over the summer without consistent instruction.” A summer reading camp can be an option for providing your kid with consistent and instructed reading support through fun summer activities, ensuring they will retain and gain reading skills. For example, some fun reading activities include word games, story cards, alphabet bingo, and rhyming games. Statistics show that grade level can also be a factor influencing the summer loss a kid experiences. For example, according to NWEA April 2026 data, math scores see the biggest drop when middle school students move to the 6th grade, while reading scores stay flat or slightly go up across most grades. Grade Transition Math RIT Change Reading RIT Change K → 1st −2.0 +0.8 1st → 2nd −5.2 −0.2 2nd → 3rd −6.4 +0.8 3rd → 4th −5.1 +0.1 4th → 5th −6.0 +0.1 5th → 6th −7.3 +0.1 6th → 7th −4.0 +0.2 7th → 8th −2.5 +0.6 Source: NWEA, 2026. According to the Newport Academy June 2026 article, summer slide can cause kids to face mental health issues like stress, anxiety, and depression. Additionally, NWEA July 2024 research shares that summer loss also affects academic performance, with students needing months of additional schooling to catch up to the knowledge level they had before the pandemic. Statistics show that kids can lose from 1 month to over a year of knowledge during the summer break. Such knowledge loss, combined with the pandemic’s effects, can leave a kid needing months of studying to catch up. For example, the NWEA July 2026 report found that 3rd graders need 1.3 months to bridge the achievement gap caused by the pandemic, while for the 8th graders, this period is over 9 months. Source: NWEA, 2024 The Newport Academy June 2026 article claims summer slide can have a negative effect on students’ mental health — kids who are behind in their learning can experience emotional stress, anxiety, lower self-esteem, higher irritability, and depression. To prevent your child from experiencing this negative impact, you can support them during the summer by encouraging them to practice and gamifying the learning practice, for example. Due to the lack of a comprehensive, comparable data system in the majority of states, statistics on the summer slide by state are insufficient. However, the summer program initiatives from Georgia, Louisiana, Massachusetts, Michigan, New Mexico, Oregon, Tennessee, Texas, and Vermont have shown some positive results, according to a January 2025 report by the Learning Policy Institute. Based on a January 2025 Learning Policy Institute report, Georgia, Louisiana, Massachusetts, Michigan, New Mexico, Oregon, Tennessee, Texas, and Vermont have adopted five key strategies to effectively address summer learning slide. These strategic initiatives demonstrate a good track record in both student participation and their academic recovery. By supporting both school districts (LEAs) and community-based organizations (CBOs), these states managed to target the right audience with their focused initiatives to have positive results. Note: Apart from state programs developed for educational agencies and organizations, you can also look for the best summer math programs or reading programs developed for kids. And if you want to enjoy the benefits of summer reading programs, you can look for one in your local library. Source: Learning Policy Institute, 2026
Get a personalized summer learning program
Our experts tailor the program according to your kids needs and learning style. To help prevent summer slide, our professional one-on-one math classes for K-12 students focus on specific math skills that are most likely to fade during summer, including multiplication fluency and multi-step word problems. We also have math worksheets you can access on our website for free to practice with your kid. Our online reading program makes reading a fun summer activity for kids while covering phonics, fluency, comprehension, and vocabulary — skills necessary to succeed in reading. For both reading and math, our pricing starts from $17.70 per lesson (20% discount applied for 12-months programs). The 2026 summer slide statistics show that math remains the subject where kids lose knowledge the most during summer break, especially if they are middle school students. One of the big contributors to summer loss is the pandemic, which has led kids to lose roughly 0.4 years worth of lost schooling at its peak — only about one in three schools have returned to their pre-pandemic performance levels in math or reading. No, the effect of summer slide can vary depending on family income, grade, and prior knowledge gains. For example, according to the still-relevant NCES May 2018 data, kids from poor households get less non-parental care over summer compared to kids from higher-income families (83% vs. 70%), which can negatively impact their summer loss. For the 10% of students who are most affected by summer slide, knowledge losses can amount to over a year, according to NWEA’s April 2026 data. As for grades, the summer slide effect is the biggest when kids transition from grade 5 to grade 6th, entering middle school. The summer slide recovery period depends on how severe the knowledge loss is and the kid’s grade. For example, NWEA April 2026 research says that struggling 5th graders must learn nearly three times faster to catch up, while NWEA July 2026 report found that if 3rd graders need 1.3 months to regain knowledge lost specifically due to the pandemic effect, for the 8th graders, this period can be over 9.3 months. Yes, summer programs can be effective at reducing the summer slide. For example, according to NWEA November 2025 research, district-funded summer programs helped slow down summer learning loss after the pandemic. If you’re looking for a free summer program in reading for your kid, you can start by checking what your local library offers. According to NWEA April 2026 data, procedural skills, math facts, multi-step computation, and fluency are the skills that are lost most during the summer break, along with vocabulary and isolated facts. These skills tend to fade away from the kid’s memory the fastest since they are usually the least practiced during the summer. Canceling a Varsity Tutors membership isn’t something you can usually do through an online account portal — you’ll need to phone their support line. This article shows you the step-by-step process of how to cancel Varsity Tutors. It also highlights what policies and guidelines you have to keep in mind to avoid unnecessary charges. Can […] Jul 02, 2025 Miacademy vs Time4Learning are two popular homeschool platforms with different approaches to learning. Miacademy is a self-paced homeschooling program based on teacher-led prerecorded videos, while Time4Learning is a parent-led homeschool curriculum with animated lessons. Brighterly offers live tutoring for homeschooled and public-school-educated students. Time4Learning vs Miacademy vs Brighterly: Side-by-Side Comparison Time4Learning and Miacademy are self-paced […] Jul 07, 2025
What Is the Summer Slide?


Summer Slide Statistics in the US: 2018–2026
Summer Slide Statistics 2018–2021
Summer Slide Statistics 2022–2026
What Is the Summer Slide Percentage?
Math vs. Reading Summer Slide Statistics


How Much Do Students Lose in Math Over Summer?

How Much Do Students Lose in Reading Over Summer?

Summer Slide Statistics by Grade Level
What Are the Effects of the Summer Slide?
Academic Performance
Mental Health Impact
What Are the Statistics on the Summer Slide by State?
5 State Strategies for Addressing Summer Slide
Summer Learning Slide Programs by State: Part 1
Summer Learning Slide Programs by State: Part 2
How Brighterly Summer Programs Help Prevent the Slide

Conclusion
Frequently Asked Questions
Does Summer Slide Affect All Students Equally?
How Long Does It Take to Recover from Summer Slide?
Are Summer Programs Effective at Reducing the Summer Slide?
What Types of Skills Are Lost Most During Summer Break?





Math & reading from 1st to 12th grade
Looking for homework support for your child?

Choose kid's grade

Math & Reading for Grades 1–12
Build real confidence for your child with a Brighterly math or reading tutor.