Why Report Cards Fail the Child Struggling in School: The Grit Gap Report
reviewed by Tamaya Govender
Updated on September 15, 2026
Key Points:
- 61% of parents report the same “my child is falling behind in school” worry across both math and reading subjects. The concern is showing up even among parents whose child brings home straight A’s (46%).
- US 15-year-olds scored 463 in math and 490 in reading on PISA 2025, among the lowest scores the country has recorded in any cycle; 35% now fall below basic proficiency in math and 26% in reading.
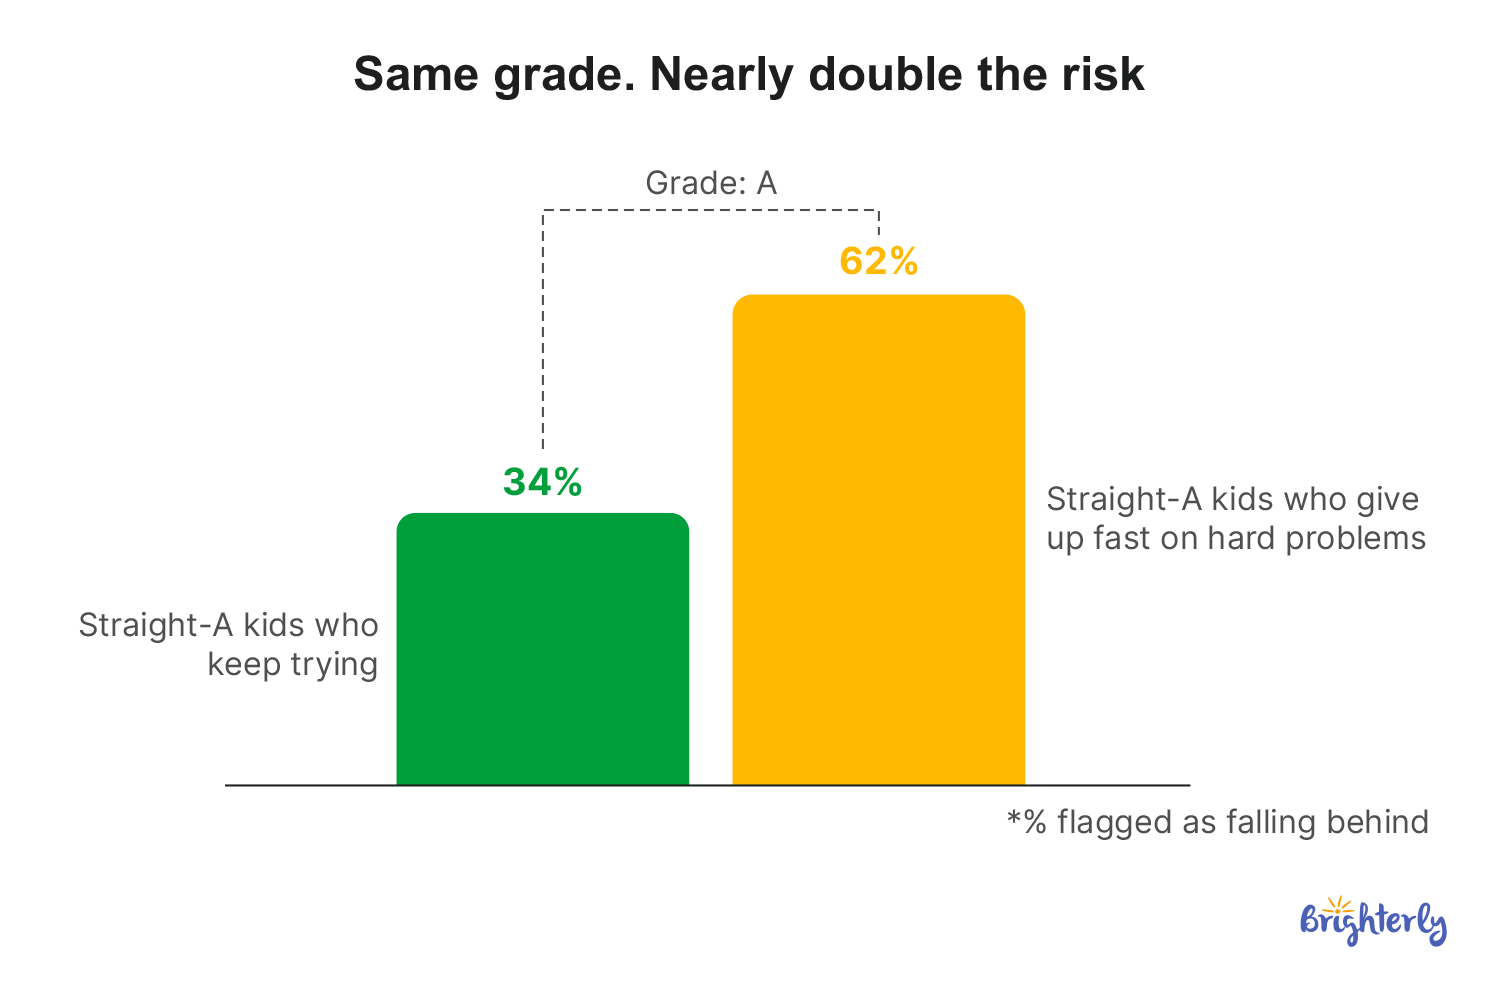
- Straight-A students are flagged as falling behind nearly twice as often when they give up quickly on difficult problems as when they continue to try: 62% compared to 34%.
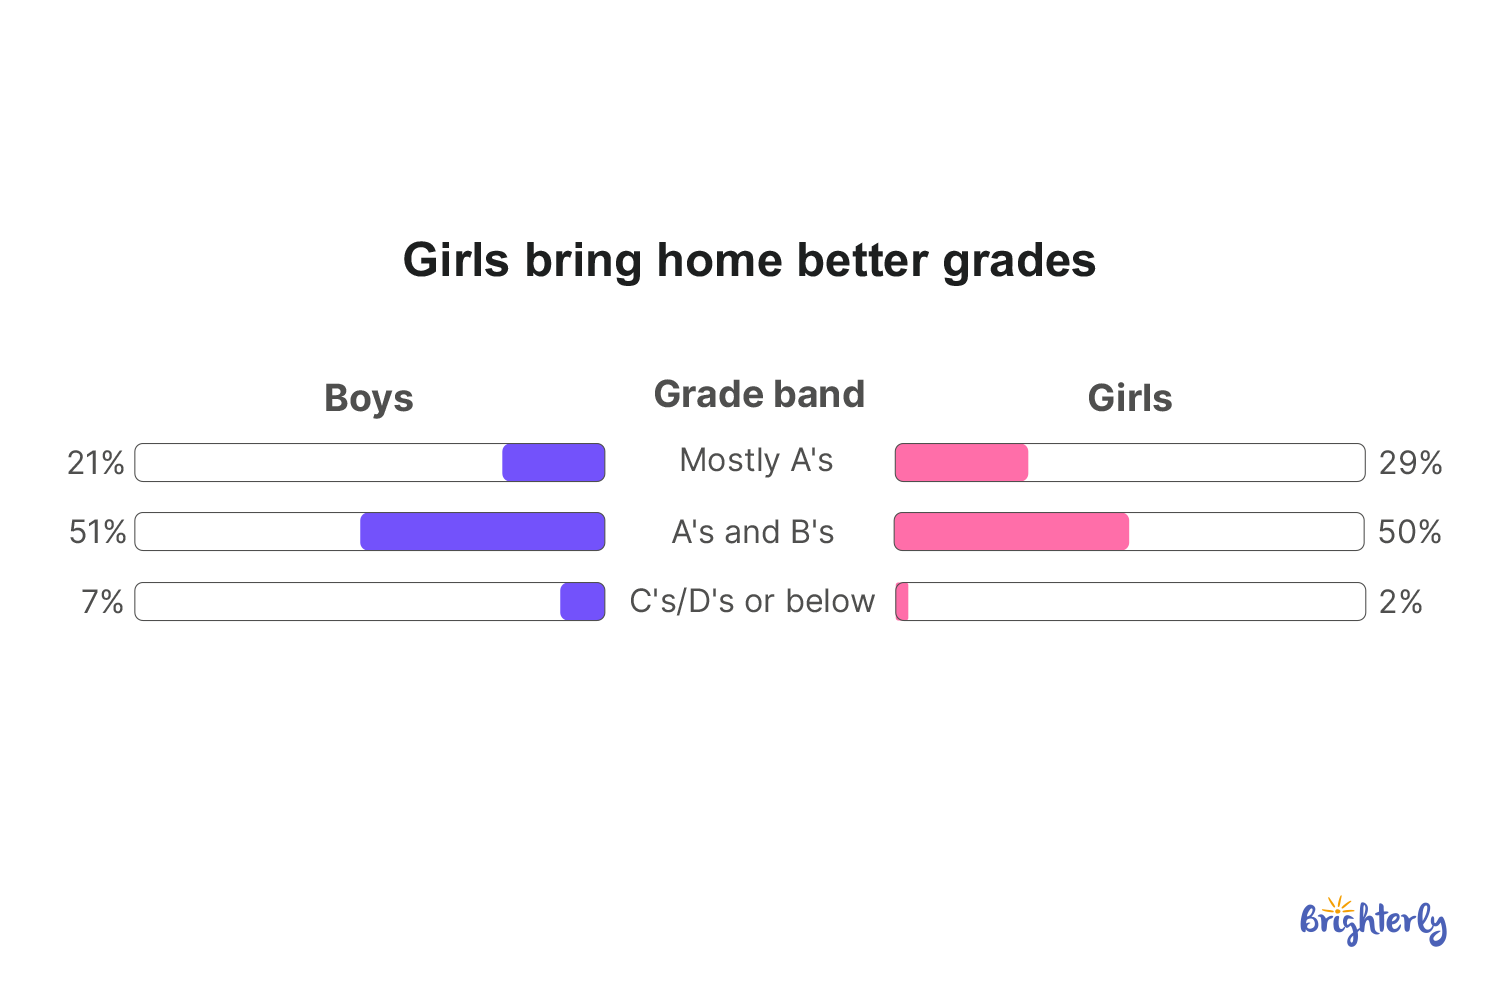
- Girls report better grades than boys, but teachers still mark them as falling behind more often, even when they are in the same grade.
- A true reward works as a motivator for almost all children, no matter what their level of persistence is; beyond that, children who struggle and those who are confident respond to almost opposite approaches.
- 51% of parents say that AI tools make it easier for a child to conceal the fact that they do not understand something; this figure increases to 67% among those parents whose child has a tendency to give up quickly.
For the majority of parents, a good report card marks the end of any discussion; if the letter grades are satisfactory, it is assumed that the child is doing all right, and an A in particular doesn’t lead them to investigate further. Brighterly wanted to find out whether a good grade tells parents what they think it tells them, or whether it conceals a child struggling in school in ways that a report card was never designed to identify.
To investigate this, Brighterly questioned 1,177 parents in the United States who have children in grades K through 10. We asked them a direct question, one deliberately separated from any inquiry about grades: over the past 12 months, has your child ever seemed to be falling behind in maths or reading? 61% replied that they had.
Math and reading are foundational subjects where student performance has long sparked debate, particularly according to NAEP assessment results. When this answer is checked against the report cards, the “yes” response is almost as common among the parents of children who are doing well in school as among those whose children are not. The assessment in the report cards and the parents’ instincts often give different results. 46% of the parents whose children come home with top A grades say the same thing. The rest of this report is an attempt to discover why.
The Report Card Paradox
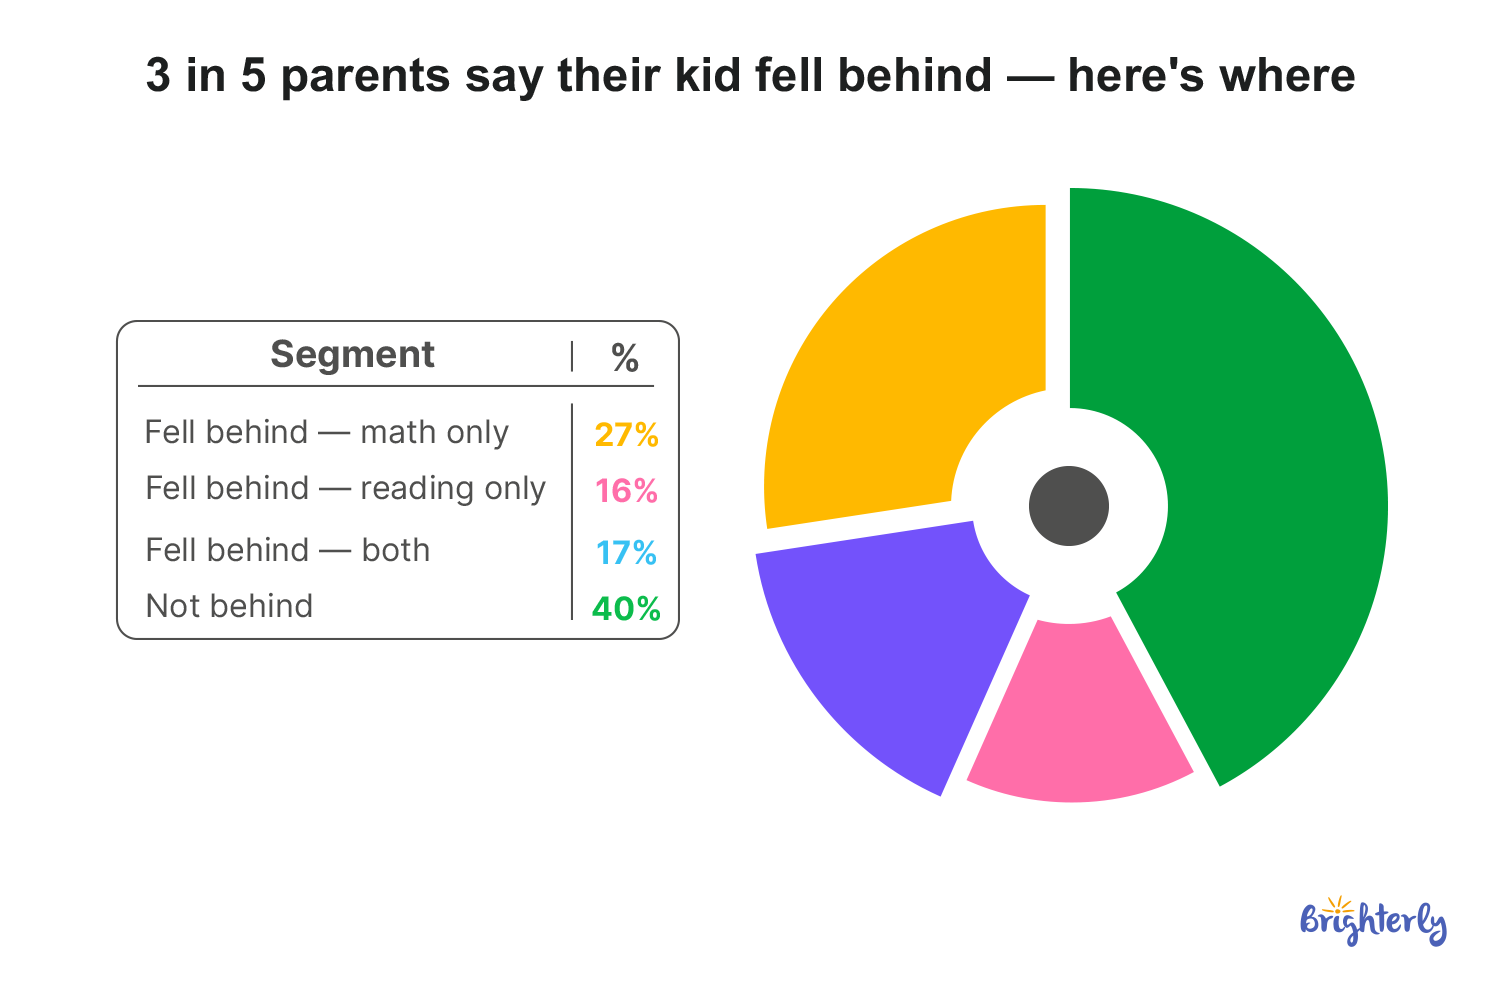
The figure of 61% breaks down as follows: 27% refer to math, 16% to reading, and 17% to both. For parents whose concerns fall within that reading slice, these literacy strategies for kids who are falling behind offer a starting point. It’s important to note that this figure reflects parent perception, not a test score. The number is also the starting point for the rest of the report.
75% of parents state that their child comes home with mostly A’s or a mixture of A’s and B’s. The two numbers aren’t contradictory on their face, at least not automatically evidence of grade inflation. A child may have difficulties in one subject and yet still end up with a good average, but the amount of overlap between the two is greater than that explanation can account for.
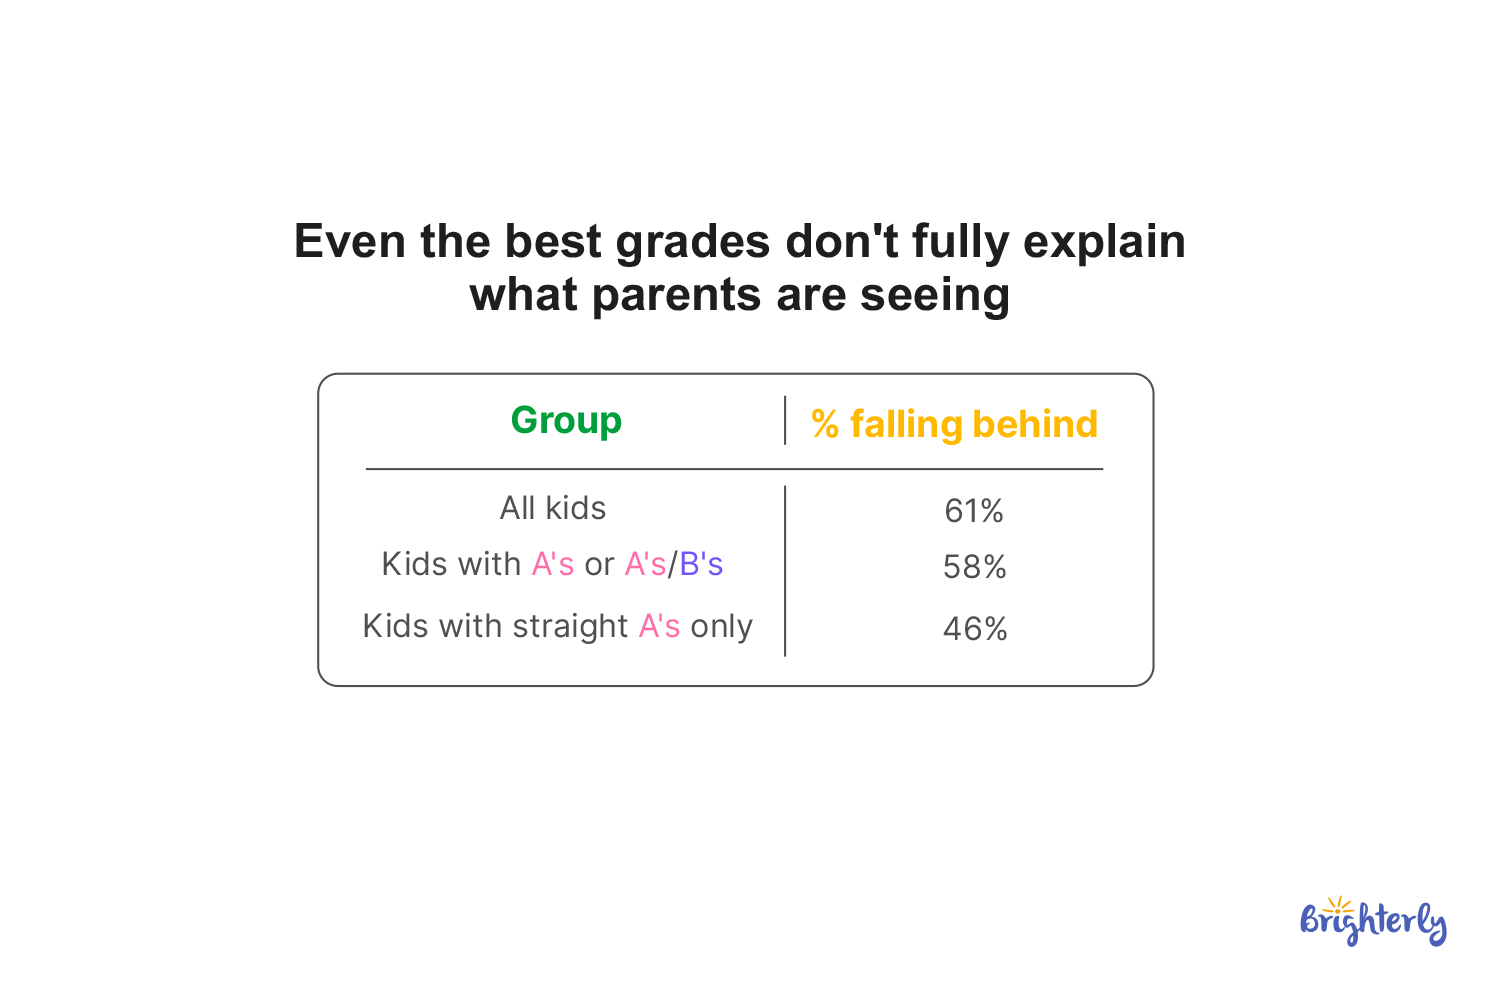
The gap is also evident within the group that is doing the best. 58% of parents of A/B students still say their child has fallen behind, and for parents of students who get straight A’s, the figure is 46%. The grade, which should be the clearest indication that “there’s no problem here,” still has nearly half of the parents saying there is a problem. This pattern lines up with what a learning gap actually looks like and how to spot one, since it often hides behind grades that seem fine on paper.
To put it in context, the NAEP 2024 results show that about 39 percent of fourth graders across the country are at ‘Proficient’ in mathematics and 31 percent in reading. The figures reported by the parents in this survey are generally in line with this situation and therefore not exceptional. Parents seem to be aware of the same thing reflected in the results of standardized tests, rather than merely responding to grade inflation.
Explore Brighterly Learning Experience
Learn exactly how Brighterly helps students thrive through expert sessions, online tools, and proven feedback from thousands of satisfied parents
What the PISA 2025 Results Mean for US Parents
The OECD published PISA 2025 results for the United States on September 8, 2026. US 15-year-olds scored 463 in mathematics, 490 in reading, and 502 in science. Reading fell 14 points below the 2022 result, and both reading and mathematics now rank among the lowest scores the United States has recorded in any PISA cycle since it joined the assessment in 2000.
35% of US 15-year-olds scored below Level 2 in mathematics — the baseline the OECD treats as basic proficiency — and 26% fell below that mark in reading. Compared with 2015, the share of low performers rose six percentage points in mathematics and seven in reading.
The OECD flagged the 2025 US sample for a data-quality caveat: student response rates and school participation both fell short of PISA’s minimum targets, so results carry added uncertainty. Separately, more than 40% of responding US students weren’t given the background questionnaire, limiting what this cycle’s US note can say about students’ school and home context.
How This Compares with What Parents Told Us
Our August 2026 survey of 1,177 US parents of children in grades K–10 found that 75% report their child earns mostly A’s, or a mix of A’s and B’s. Of those parents, 58% also believed their child had fallen behind in math or reading during the past 12 months. Among parents reporting straight A’s, that figure was 46%.
Report cards and standardized assessments are telling US families two different stories. The PISA 2025 results point to which one is measuring proficiency.
Persistence Predicts Falling Behind Better Than A’s Do
Considering that grades directly reflect performance, A graders should rarely be flagged as struggling. Almost half are. The difference comes down to persistence: how long a child keeps trying on a hard math problem before giving up or asking for help, on a scale from “gives up almost immediately” to “keeps going until they get it.”
Psychologist Angela Duckworth’s research on grit made the case that this kind of sustained effort predicts outcomes independently of raw ability — and the data here bear that out at the report-card level. That gap is really a growth mindset for kids question in disguise — whether a child treats a hard problem as something to push through or as a sign to stop.
When the straight-A students are divided according to their answers, the most noticeable difference in the dataset is seen. Those straight-A students who give up quickly are marked as falling behind at a rate almost twice as high as those straight-A students who continue to try: 62% compared to 34%.
Although both groups have the same grade on their report cards, it is not their academic performance as recorded by the school that differs, but rather how the child reacts when a problem becomes difficult. It’s the kind of difference a growth mindset for kids framework is built to explain.
The pattern isn’t limited to top students. Across all the learners, the relationship between persistence and reported struggle forms a straight staircase — falling-behind rates dropping at each step as persistence increases:
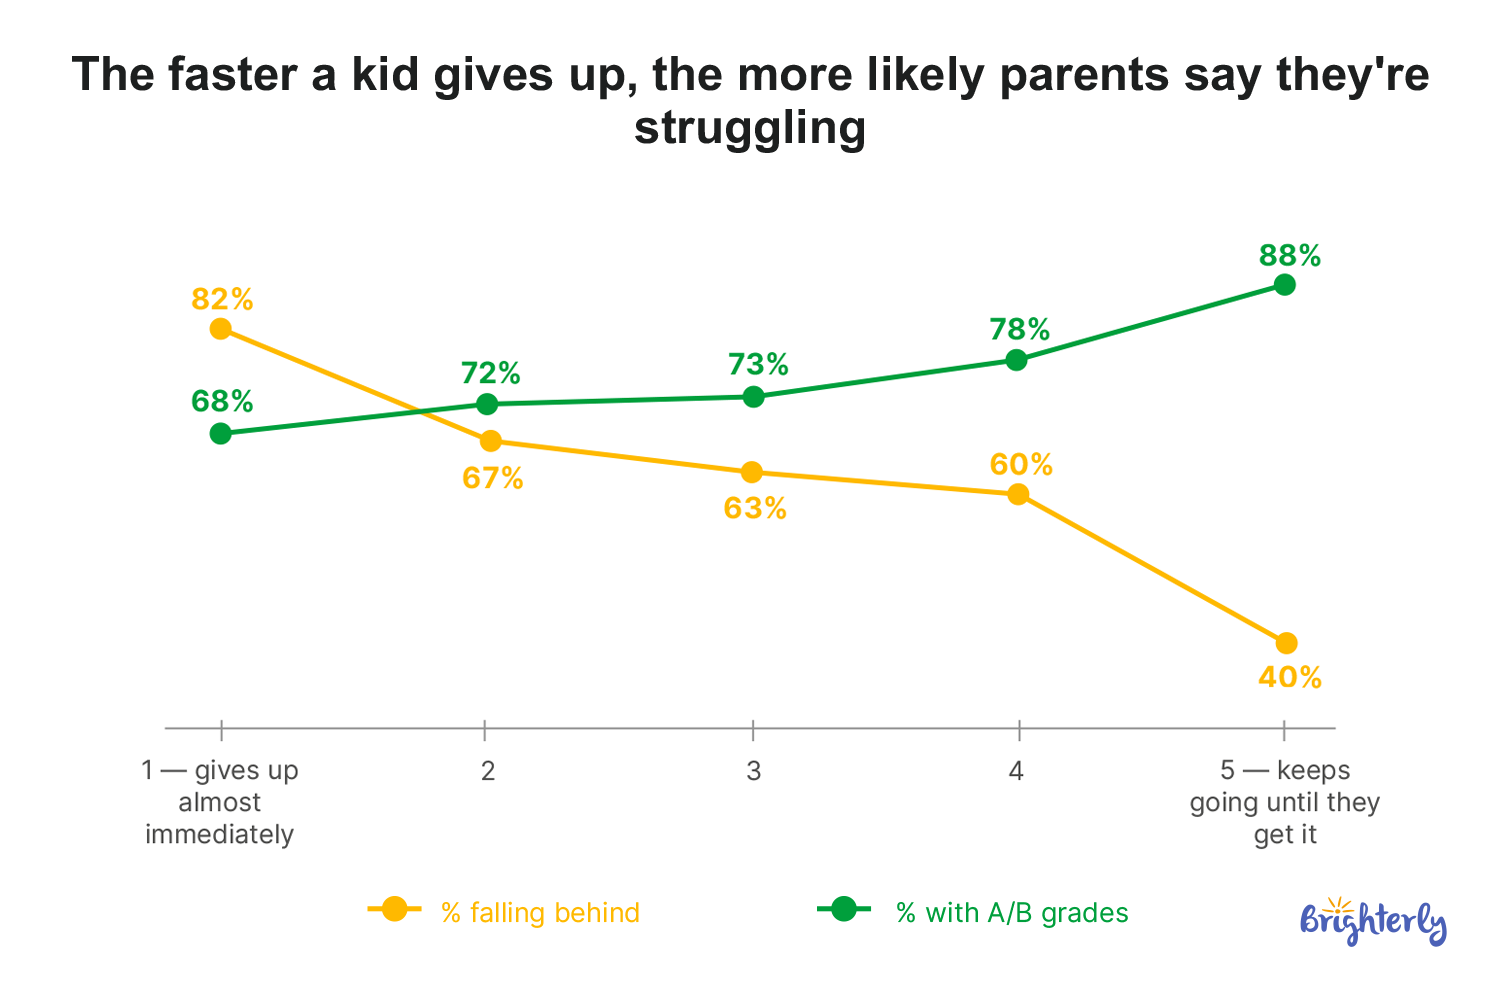
Persistence is also correlated with grade quality, but the correlation is weaker than that observed for falling behind. The grades increase only slightly as the level of persistence rises, but the rate at which students fall behind decreases much more sharply — even among those who maintain an ‘A’ throughout.


Grades don't tell the whole story
Book lessons with a tutor who builds foundations and persistence
Girls Get Better Grades but Are Flagged as Falling Behind More Often
Girls report better grades than boys on every measure in this survey: more A’s, far fewer low grades.
Yet girls are more often marked as falling behind. This is true both when looking at the entire sample and when comparing within the matched grade groups: for children who mostly have A grades, 49% of the girls are flagged as falling behind, as compared with 43% of the boys. Comparing matched grades rules out the simplest explanation — that girls are just held to a higher standard.
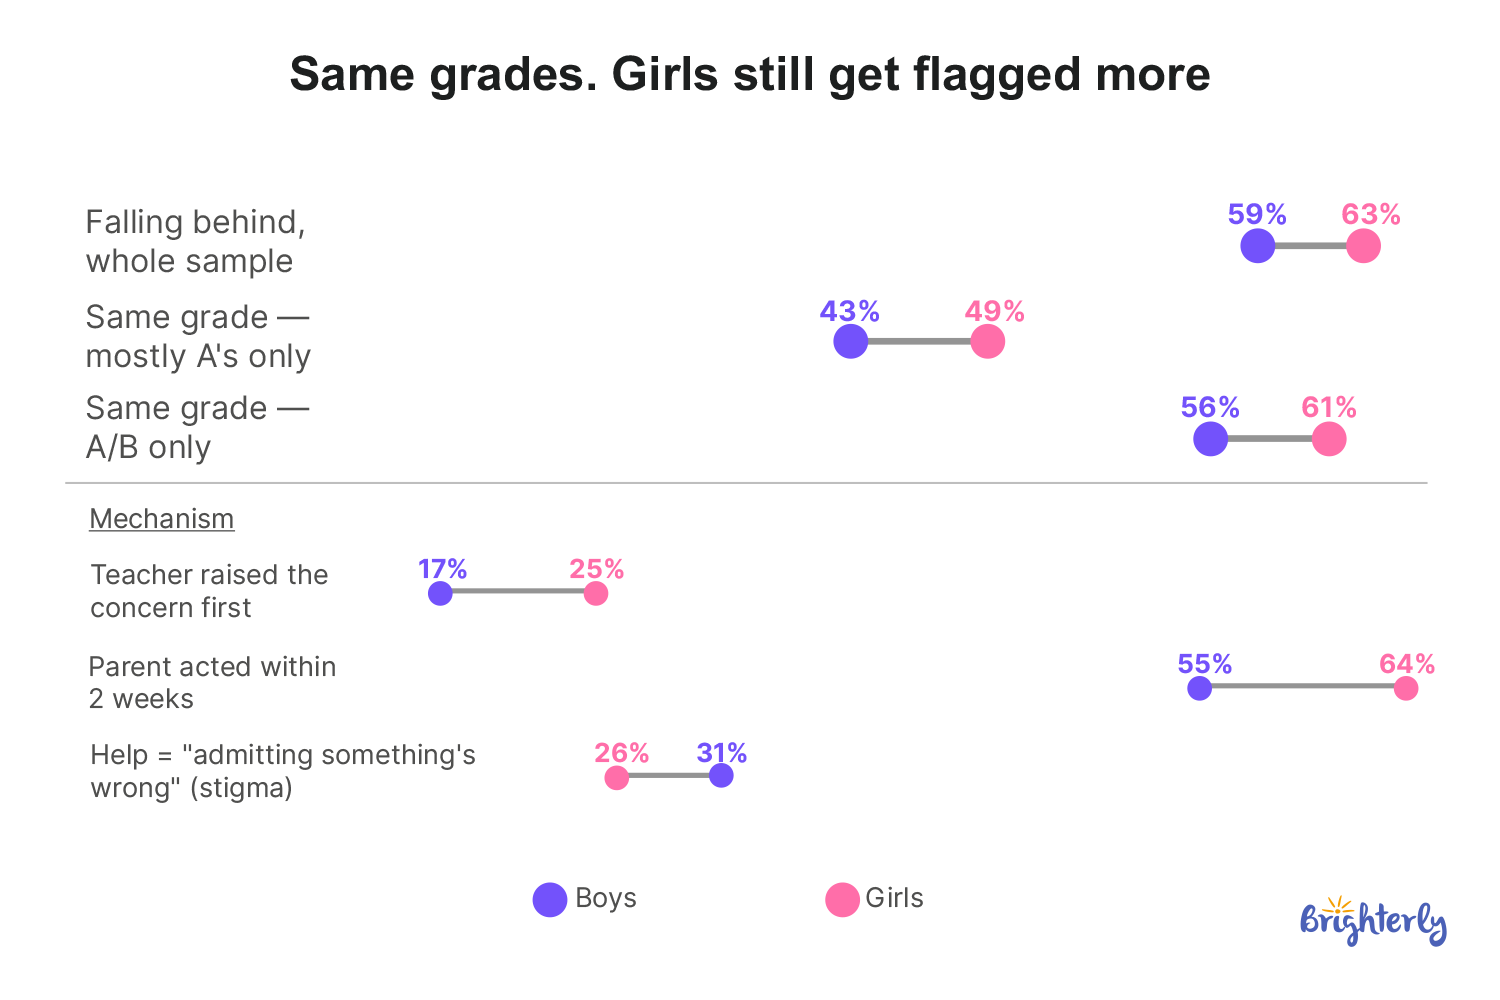
You can notice the mechanism behind the gap, rather than a coincidence in the numbers.
Teachers are more concerned about girls, parents act more quickly when they notice a problem, and parents show less hesitation in getting help for a girl than for a boy. This shows a tendency toward earlier, quicker responses in girls, not necessarily because girls and boys differ in how much they struggle.
It is not persistence that accounts for the gap: girls say that they are either equal to or even slightly more persistent than boys when doing math homework (20% saying they “keep going” compared to 16%), and the rates at which they give up are almost the same (10% compared to 9%).
Note: For a deeper dive into STEM statistics regarding gender gaps, please check this guide.
How to Motivate Kids to Study: What Works for Different Persistence Levels
A reward that is actually given — such as money, screen time, or a treat — is about the same among both children with low persistence and those with high persistence, with 44% of the parents of low-persistence children and 42% of the parents of high-persistence children choosing it. It is by far the most commonly selected incentive in both groups, and there is almost no difference between them.
Past that point, the two groups in question diversify significantly in terms of impactful motivators:
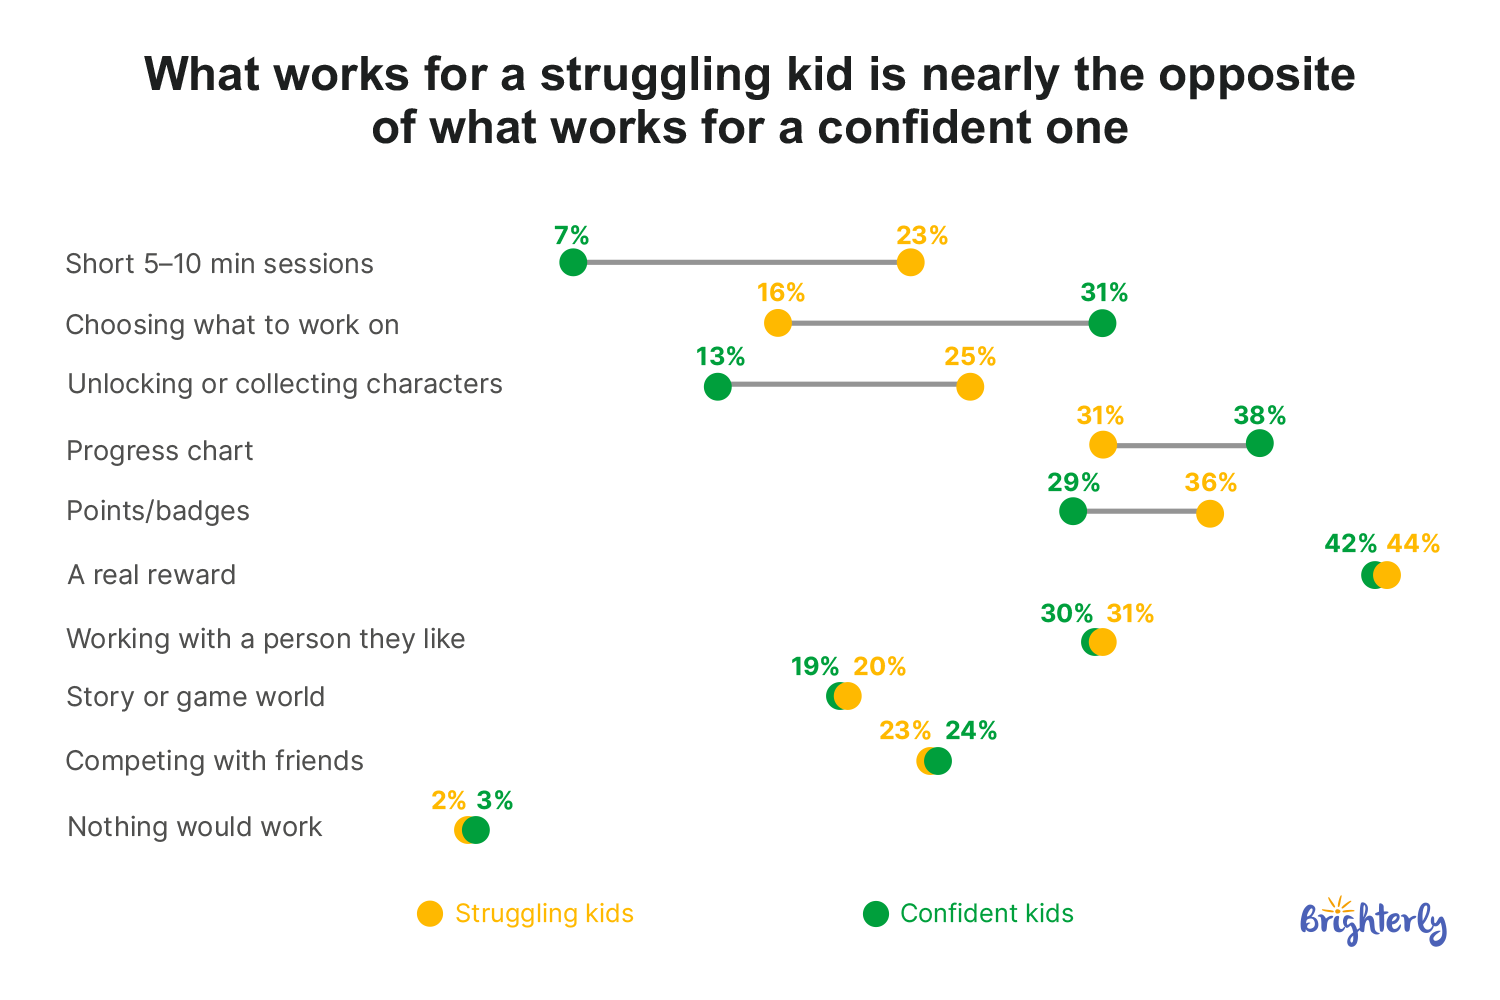
Children who stop quickly are more likely to respond to short, structured formats that provide fast feedback — such as short sessions, earning points, and access to unlockable content. This matters most in the moment a kid struggling with homework is deciding whether to keep going or give up: a fast, visible payoff can be the difference between pushing through and walking away.
On the other hand, children who are already persistent respond better to options that offer autonomy and visible progress, even though this requires them to tolerate a delay before seeing the reward.
Advice based on ‘giving the child more choice’ applies to the second group, not the first; applying it to a child who gives up within minutes requires a degree of patience towards a delayed reward that has not yet developed.
“'Sticking with a hard problem' and 'sitting there frustrated' are two different things, and only one of them is learning.”


Where Parents Turn — And Why They Don’t Fully Trust AI
When something worries them about their child’s schoolwork, 48% of parents turn to the teacher first. The other options that they use for feedback can vary substantially:
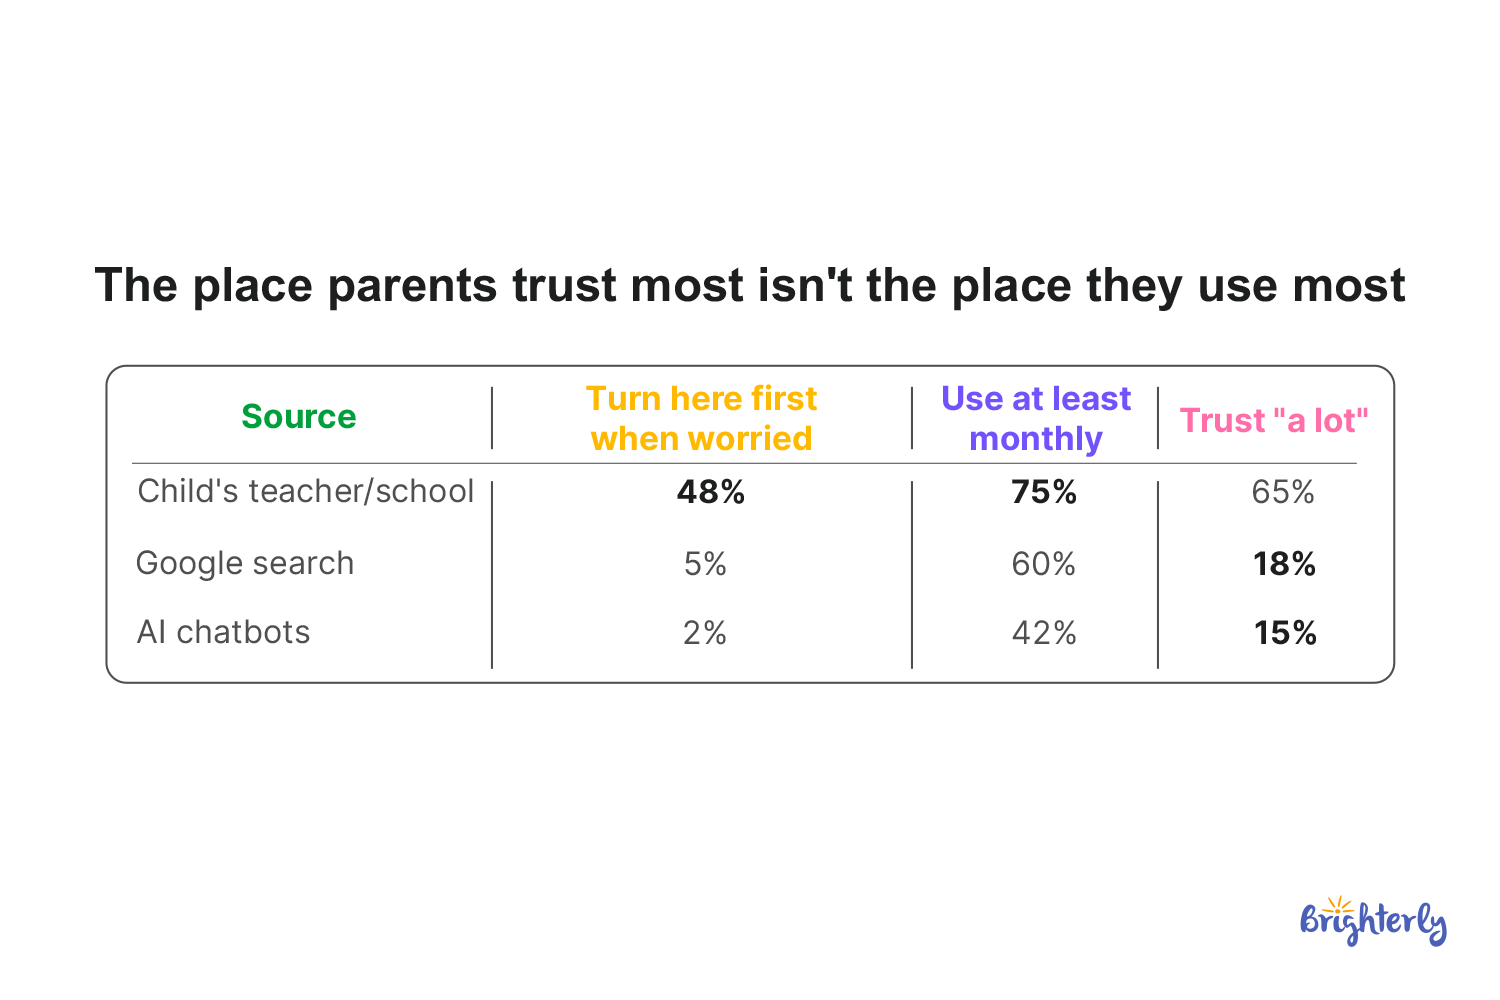
Google and AI chatbots are used regularly far more than they are trusted. Younger parents are much more likely to rely on AI chatbots for parenting and school advice than older parents (61% vs. 30%). This may explain why usage outpaces trust since it is a newer habit rather than an established one. The teacher is the only row in this table where use and trust move roughly together.
Specifically on AI, 51% of parents agree that AI tools make it easier for a child to hide that they do not understand something. Parents whose kids already show the give-up-fast pattern are the most worried that AI will make it easier to avoid the same problem going forward, a 25-point gap from parents of high-persistence kids.
Note: AI usage has already been strictly controlled in the US schools. For more details on the topic, check the article.
How Can Brighterly Help Reluctant & Struggling Learners
The program data compiled by Brighterly itself allows us to examine one aspect of this pattern: the changes that occur first when a struggling child begins to receive consistent, structured support.
The first change is confidence. 46% of parents in Brighterly stated that this was the first noticeable change they saw after their child started the lessons, preceding willingness to do homework (14%), the child beginning to explain the concepts back (9%), and the grade itself (7%). Grades were the least frequently given answer. This is identical to the result of the national survey referred to above — the child’s readiness to tackle a difficult problem changes before the report card marks grow.
Of the Brighterly parents who felt that they were able to judge (excluding those who thought it was still too early to tell), 88% said that their child’s grade in the subject had improved since beginning the program. This result is based on Brighterly’s own customer group, not the national sample used in other parts of this report, so it cannot be directly compared. Nevertheless, it suggests the same thing: improvement generally begins with persistence rather than with the grade.
If you’re reading this and wondering, “My child is struggling in school, what do I do?” — the data here points to a starting place: focus less on the grade in front of you and more on how your child responds the next time something is hard. At the start of a new school year, this back-to-school advice can also help you tell the difference between a temporary adjustment and a problem that needs more support.
Needing help? Brighterly is an online learning platform that helps K–12 students build strong foundations in both math and reading. It does this by using one-on-one tutors and intelligent practice tools, thereby narrowing gaps, building children’s confidence, and helping each of them progress step by step.
Watch your kid's academic confidence grow!
Structured, 1:1 lessons help reluctant learners — many parents notice first results within weeks.
Frequently Asked Questions
How Common Is It for a Child to Be Struggling in School Without It Showing up on Their Report Card?
61% of parents say their child fell behind in math or reading at some point in the past 12 months. That includes 58% of parents whose kids bring home A’s or A’s and B’s, and 46% of parents whose kids bring home straight A’s.
Can a Child Get Good Grades and Still Be Struggling?
Yes. Among parents of straight-A students, 46% still say their child fell behind, and more than a third of those cases are specifically in math. The report card and the parents’ sense of how the child is doing frequently don’t agree.
Why Is My Child Struggling in School Despite High Grades?
The best predictor in this survey is persistence, not the grade. Straight-A kids who give up quickly on a hard problem are flagged as falling behind nearly twice as often as those who keep trying (62% vs. 34%). Simultaneously, both groups have the same grade on paper.
Are Girls or Boys More Likely to Be Flagged as Falling Behind?
Girls report better grades overall. Among children in the same grade, 49% of girls who mostly have A’s are identified as falling behind, compared with 43% of boys. Importantly, both teachers and parents are more likely to raise concerns about girls. This seems to explain the gap better than any actual difference in perseverance.
What Are the Best Motivators for Kids with Different Levels of Persistence?
An immediate reward, such as money, screen time, or a treat, helps almost all children regardless of persistence (44% with low persistence and 42% with high persistence). A child struggling with homework responds better to short sessions. Confident children respond better to having a choice and seeing visible progress.
Does AI Make It Easier for Kids to Hide that They Don’t Understand Schoolwork?
51% of parents believe so. That concern is greatest, at 67%, among parents whose child gives up quickly on hard problems, and lowest, at 42%, among parents of kids who persist. Younger parents are also much more likely to use AI chatbots for parenting and school advice than older parents (61% vs. 30%).
Where Do Parents Turn First when Worried About Their Child’s Schoolwork?
The teacher, by a wide margin (48%). Google search and AI chatbots are also used regularly each month, but parents trust them far less than the teacher.
Methodology: survey of 1,177 US parents of children in grades K–10, conducted in August 2026, weighted to reflect the national population of parents in this age range. All findings are based on parent-reported perception, not independent assessment or test scores. The figures unique to Brighterly in the concluding section are based on a separate survey of Brighterly’s customer base, not the weighted national sample.


The best online writing classes for kids in 2026 include Brighterly, Outschool, WriteShop, Brave Writer, Essentials in Writing, Athena’s Advanced Academy, Writing Wonders, and 826 Digital. They range from personalized 1:1 tutoring to live group classes and self-paced curricula, giving families options for different ages, writing goals, schedules, and budgets. Top Online Writing Courses for […]
Aug 23, 2026
Moving from kindergarten to first grade may be quite a leap for a child. There, what can ensure kids’ growth is understanding the math skills they should learn. This 1st grade math skills checklist explains “what do 1st graders learn in math” and shares a few tips for parents. Core Math Skills Every 1st Grader […]

Sep 02, 2026
Math & reading from 1st to 12th grade
Looking for homework support for your child?

Choose kid's grade

Math & Reading for Grades 1–12
Build real confidence for your child with a Brighterly math or reading tutor.