Why Reading Level Conversion Charts Differ by School District
reviewed by Ann Carlen A. Flores
Updated on October 29, 2026
Key Points: Your child’s school report card, the library shelf, and a reading app may all show different reading levels — they all can be right, because each may use a different scoring system and often a different chart to compare them. See what a reading level conversion chart shows, why charts may give different numbers for the same score, and what you can do when your child’s reading level doesn’t match across systems. A reading level equivalency chart (same as a conversion chart) puts scores from different reading systems side by side — the systems include Lexile, Guided Reading Level (GRL), DRA, and AR. Basically, if you take your child’s score in one system, the chart gives you an estimate of where that score falls across other systems. Teachers, librarians, reading apps, and book vendors use these charts to match children with level-appropriate books, while parents can use these charts to make sense of a school score report that may list levels from different systems.
See your child’s real reading level
Take a reading diagnostic test to determine the student’s real reading skills. Explore Brighterly Learning Experience Learn exactly how Brighterly helps students thrive through expert sessions, online tools, and proven feedback from thousands of satisfied parents Two published charts can show different numbers for the same score because nobody tests the same kids on every reading leveling system. Instead, each chart provider just makes their own judgment about the band edges of each system. Schools then usually post whichever chart came with their program. Besides, different US states share Lexile ranges in different ways, which also explains why reading levels differ for the same score. Reading Levels Published Charts Comparison for Grade 2 ⚠ = differs from Brighterly’s row. Source Guided Reading DRA Lexile Brighterly J–M 16/18–24/28 420L–650L Literably K–M ⚠ 20–28 ⚠ 420L–650L Scholastic E–N ⚠ 8–30 ⚠ 420L–650L Greenbrook Elementary J–M 18–28 ⚠ 400L–500L ⚠ (posted in round hundreds) Kitaboo J–M 18–28 ⚠ 300L–500L ⚠
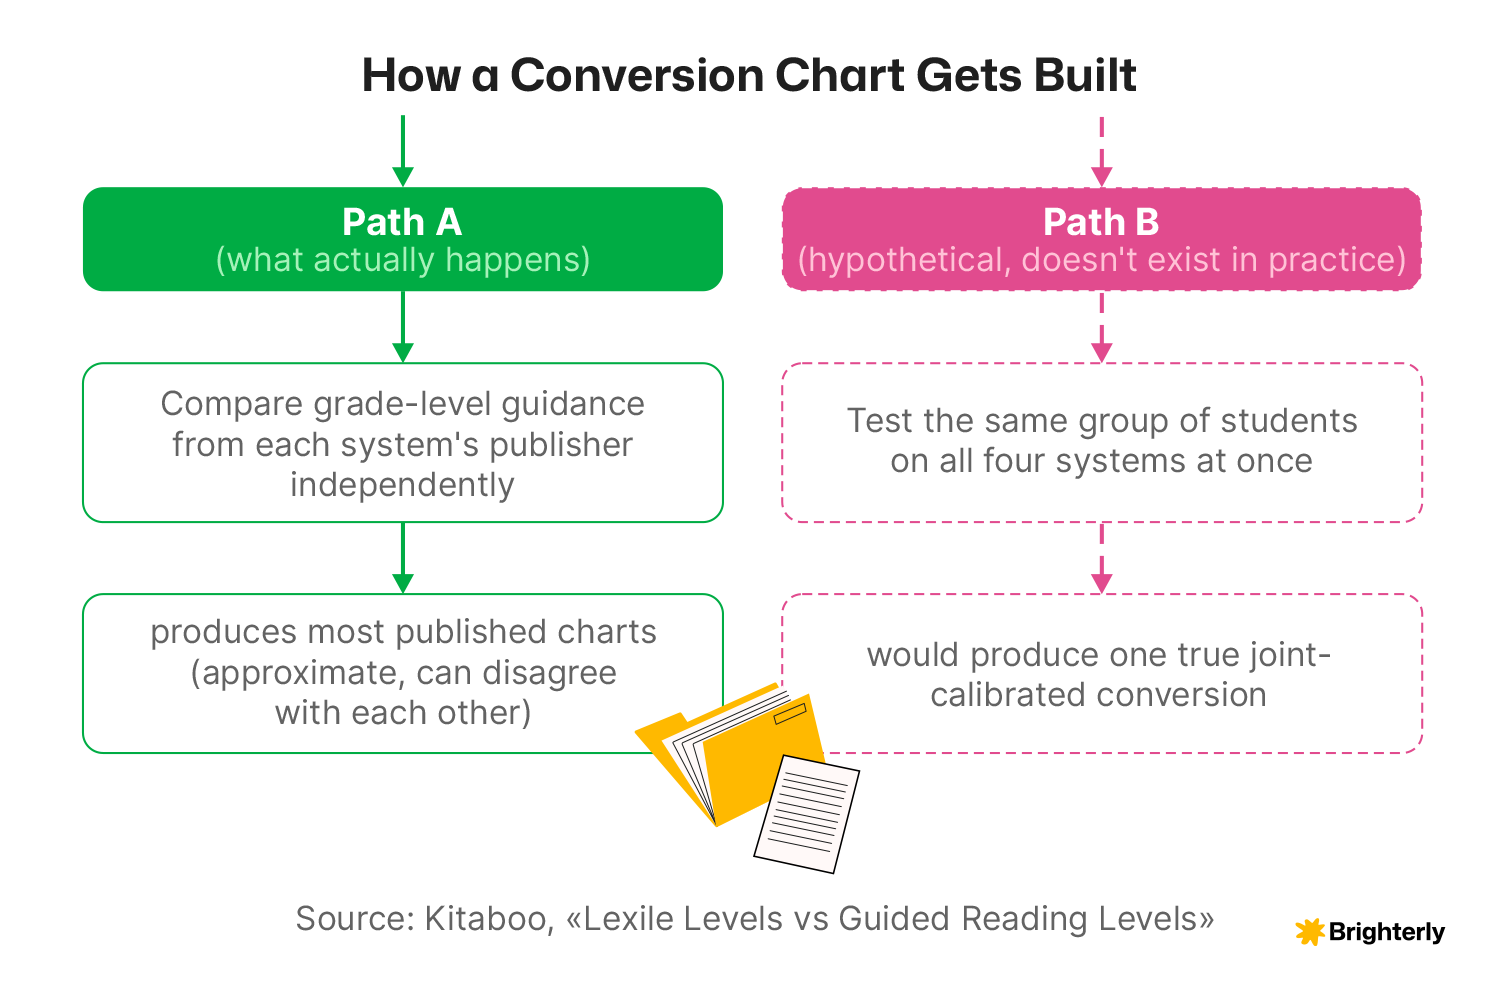
Sources: Brighterly (2026), Literably (2022), Scholastic (2020), Greenbrook Elementary, Kitaboo (2026). According to Kitaboo’s 2026 article, Lexile (MetaMetrics chart), Guided Reading (Fountas and Pinnell), and DRA (Pearson) systems were built separately — no study has tested the same students on all three. Chart makers simply place each system’s grade guidance side by side and decide where each band starts and ends. For example, Literably’s chart starts Grade 2 DRA at 20, while Brighterly reading level by grade chart starts it at 16/18. Kitaboo ends the Grade 2 Lexile band at 500L, while Brighterly runs to 650L. The charts disagree most in kindergarten and Grade 1 — Lexile gives every very early book the same label, “BR” (Beginning Reader), so it can’t tell a simple pattern book from a slightly harder one, while Guided Reading and DRA split those books into separate levels (A, B, C and 1, 2, 3) to be able to do so. Greenbrook Elementary, a San Ramon Valley school, titles its page a Guided Reading/Lexile conversion table and credits Rigby Education, Scholastic Lexiles, and a 2000 book on book leveling. Scholastic publishing company, Literably literacy assessment platform, and Fountas and Pinnell conversion chart (balanced literacy framework) each publish their own charts too. So, each school posts whichever program chart it already uses, which can result in a difference in school district reading levels, but this difference doesn’t mean any school’s chart is incorrect. Georgia’s Department of Education lists Grade 2 reading level at 420L–650L and gives students a Lexile conversion chart measure with their Georgia Milestones ELA score, while Nevada’s Lexile page provides no grade table — it points families to MetaMetrics tools and suggests books from 100L below to 50L above a student’s measure. Besides, a state test and a teacher’s running record measure different things on different days, so a Lexile chart can disagree with a classroom DRA result without either making a mistake.
Online reading support with a tutor
Professional educators personalize reading lessons according to your child’s level and needs. No, there’s no correct conversion chart. While you can find plenty of those charts online, they are all approximations, and none of them is official or more correct than the other. Besides, major organizations like MetaMetrics (creators of Lexile) and Fountas & Pinnell (creators of Guided Reading) state that their systems do not align directly, which means they can’t be compared to determine which one is more “correct”. One reading level conversion table differs from the other one because compilers build each of those tables independently from every publisher’s grade guidance, and schools post whichever chart fits their program. Your child’s reading level is the score from the assessment the school actually uses, read as a range. Every other chart is a helpful, but approximate second opinion. If you are still confused about those systems, book a free class with our tutor to get help. No, there’s no official or universal chart for DRA to Lexile conversion. MetaMetrics creates and owns the Lexile framework, and Pearson publishes the DRA — neither organization officially endorses or publishes a cross-reference standard that can be used to convert them. No, all schools in the same district do not necessarily use the same reading level system. While many districts recommend or adopt one standard system (such as Lexile or DRA), individual schools, grade levels, or teachers often use different assessment tools and tracking systems. No, a DRA score cannot be converted into an exact Lexile number, as there’s no universal mathematical formula that links these two systems. The two systems measure different things with different methods — DRA evaluates oral reading fluency, accuracy, error patterns, and comprehension through a teacher-led observation, while Lexile measures semantic difficulty and syntactic complexity of text (or reader comprehension ability) on a psychometric scale. To determine which chart to trust, check each chart’s date and named sources, then compare your child’s results over several testing periods instead of relying on one score. If the numbers still pull in different directions, consider a direct skills check through a reading test for a clearer view. Is Calculus hard? The answer to this question depends on the child, but most high school students do find Calculus one of the hardest courses, and not just among math-related ones. Find out the reasons why your child may have trouble with Calculus, when they take it, why it matters for college, and what you […] Oct 23, 2026 Homework stress can be an issue for many families, bringing confusion about whether they need to push or pause. Much depends on what is behind the stress: a skills gap, pressure, or disorganization. This guide shows how homework may bring tension, how to decrease it with home and task management, and when to ask a […] Oct 27, 2026
What a Reading Level Conversion Chart Shows


Why Two Published Charts Can Show Different Numbers for the Same Score
Charts Are Built by Comparing Grade Bands, Not by Testing the Same Students on Both Systems
Schools and Libraries Often Post Whichever Chart Came With Their Assessment Program
State Education Pages Share Lexile Bands in Different Forms
What to Do When Your School’s Score Doesn’t Match Another Source
Is There One “Correct” Conversion Chart?
Conclusion
Frequently Asked Questions
Is There an Official, Universal Conversion Chart for Lexile to DRA?
Do All Schools in the Same District Use the Same Reading Level System?
Can a DRA Score Be Converted to an Exact Lexile Number?
Which Reading Level Chart Should I Trust If My School Gives Me One and an App Gives Me Another?




Math & reading from 1st to 12th grade
Looking for homework support for your child?

Choose kid's grade

Math & Reading for Grades 1–12
Build real confidence for your child with a Brighterly math or reading tutor.